Broadcom: AI Is Most of the Growth. What About the Rest?
AI supplied about 84% of Broadcom's Q3 FY2026 revenue increase. A source-led breakdown shows software's contribution, upfront-license timing and concentration.
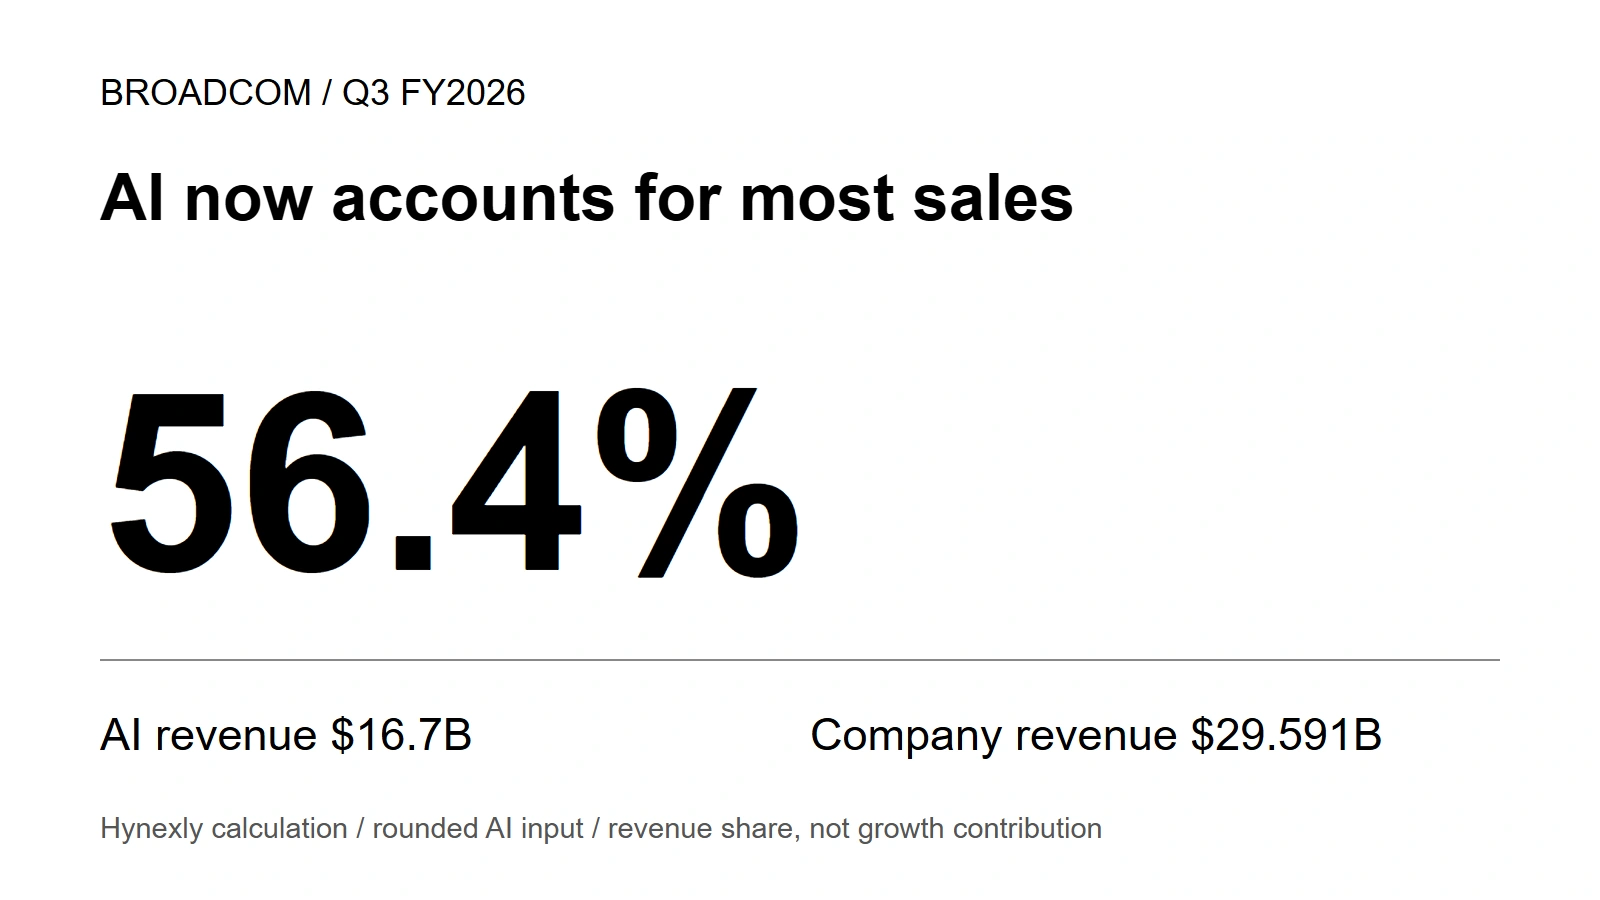
AI now accounts for more than half of Broadcom's sales. But the more revealing question is where the extra sales came from. Of every $100 the company added compared with the year-earlier quarter, about $84 came from its reported AI semiconductor category.
Software supplied most of the rest. That sounds like a second growth engine, and there is real growth to examine. Its contract accounting also matters: revenue recognized upfront explains much of the software increase. Broadcom is growing quickly; extrapolating the same pace across its portfolio would miss how that growth was produced.
AI crossed the halfway mark
The change is visible without a forecast. Compare reported AI revenue with company revenue in each quarter; do not confuse that share with AI's contribution to growth.
| Revenue measure | Q2 FY2026 | Q3 FY2026 |
|---|---|---|
AI semiconductors | $10.8B | $16.7B |
Whole company | $22.187B | $29.591B |
Calculated AI share | 48.7% | 56.4% |
Sources: June 3 results and September 2 results. Fiscal quarters, not calendar-year totals; AI figures are rounded.
A majority share tells us what Broadcom sells today. A growth contribution tells us what changed since the comparison period. Those are different denominators. Neither supplies a margin for the AI business, which the selected release and quarterly filing do not report separately.
Follow the extra revenue
Start with the original numerical fields, then subtract the year-earlier quarter. This comparison uses the previously reported AI amount directly, rather than reconstructing it from a rounded growth rate.
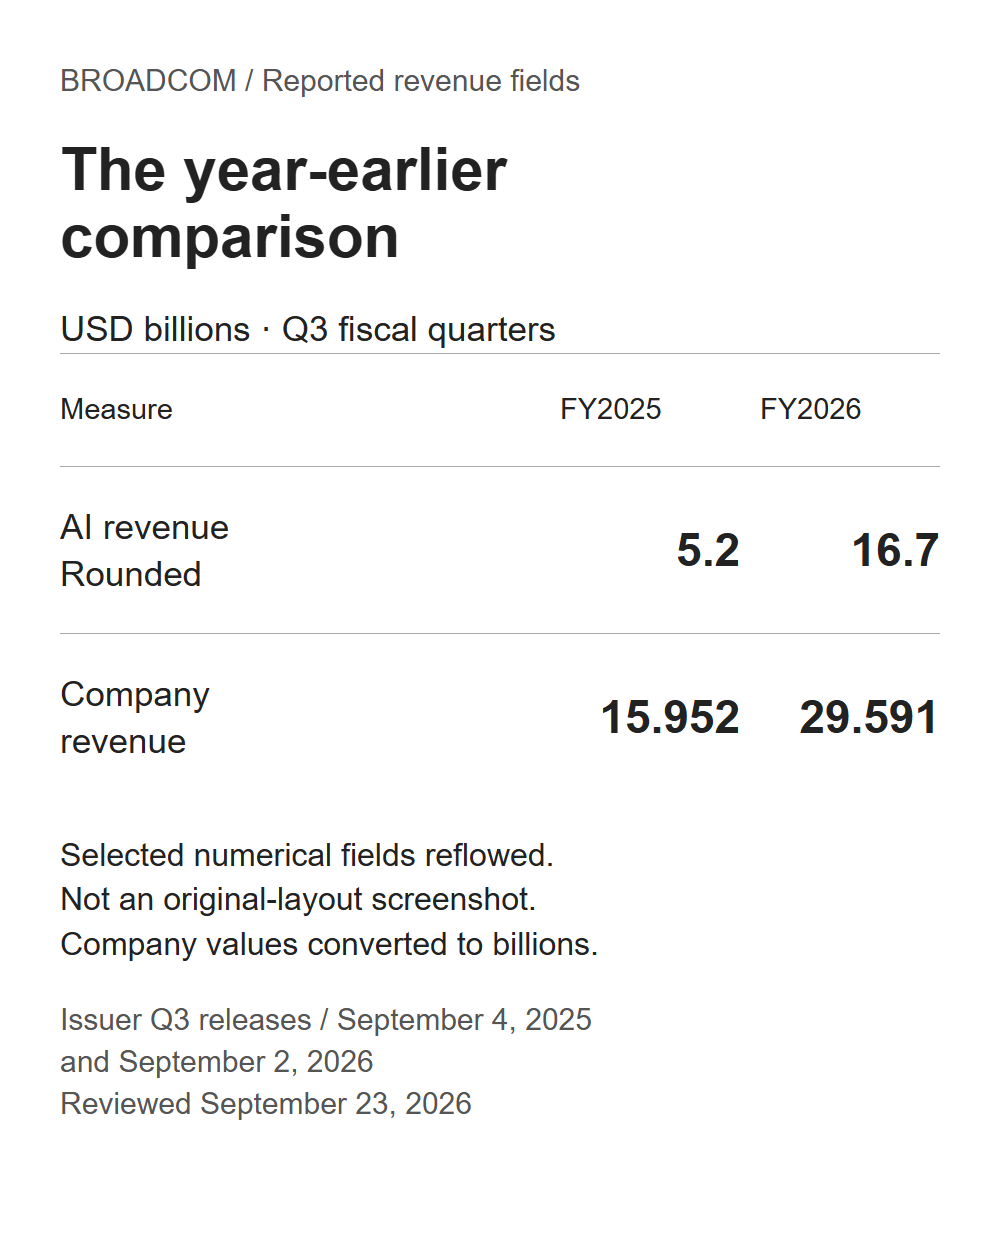
Total sales increased by $13.639B. AI contributed about $11.500B. Software added $1.966B. That leaves about $0.173B from semiconductors outside the company's AI category.
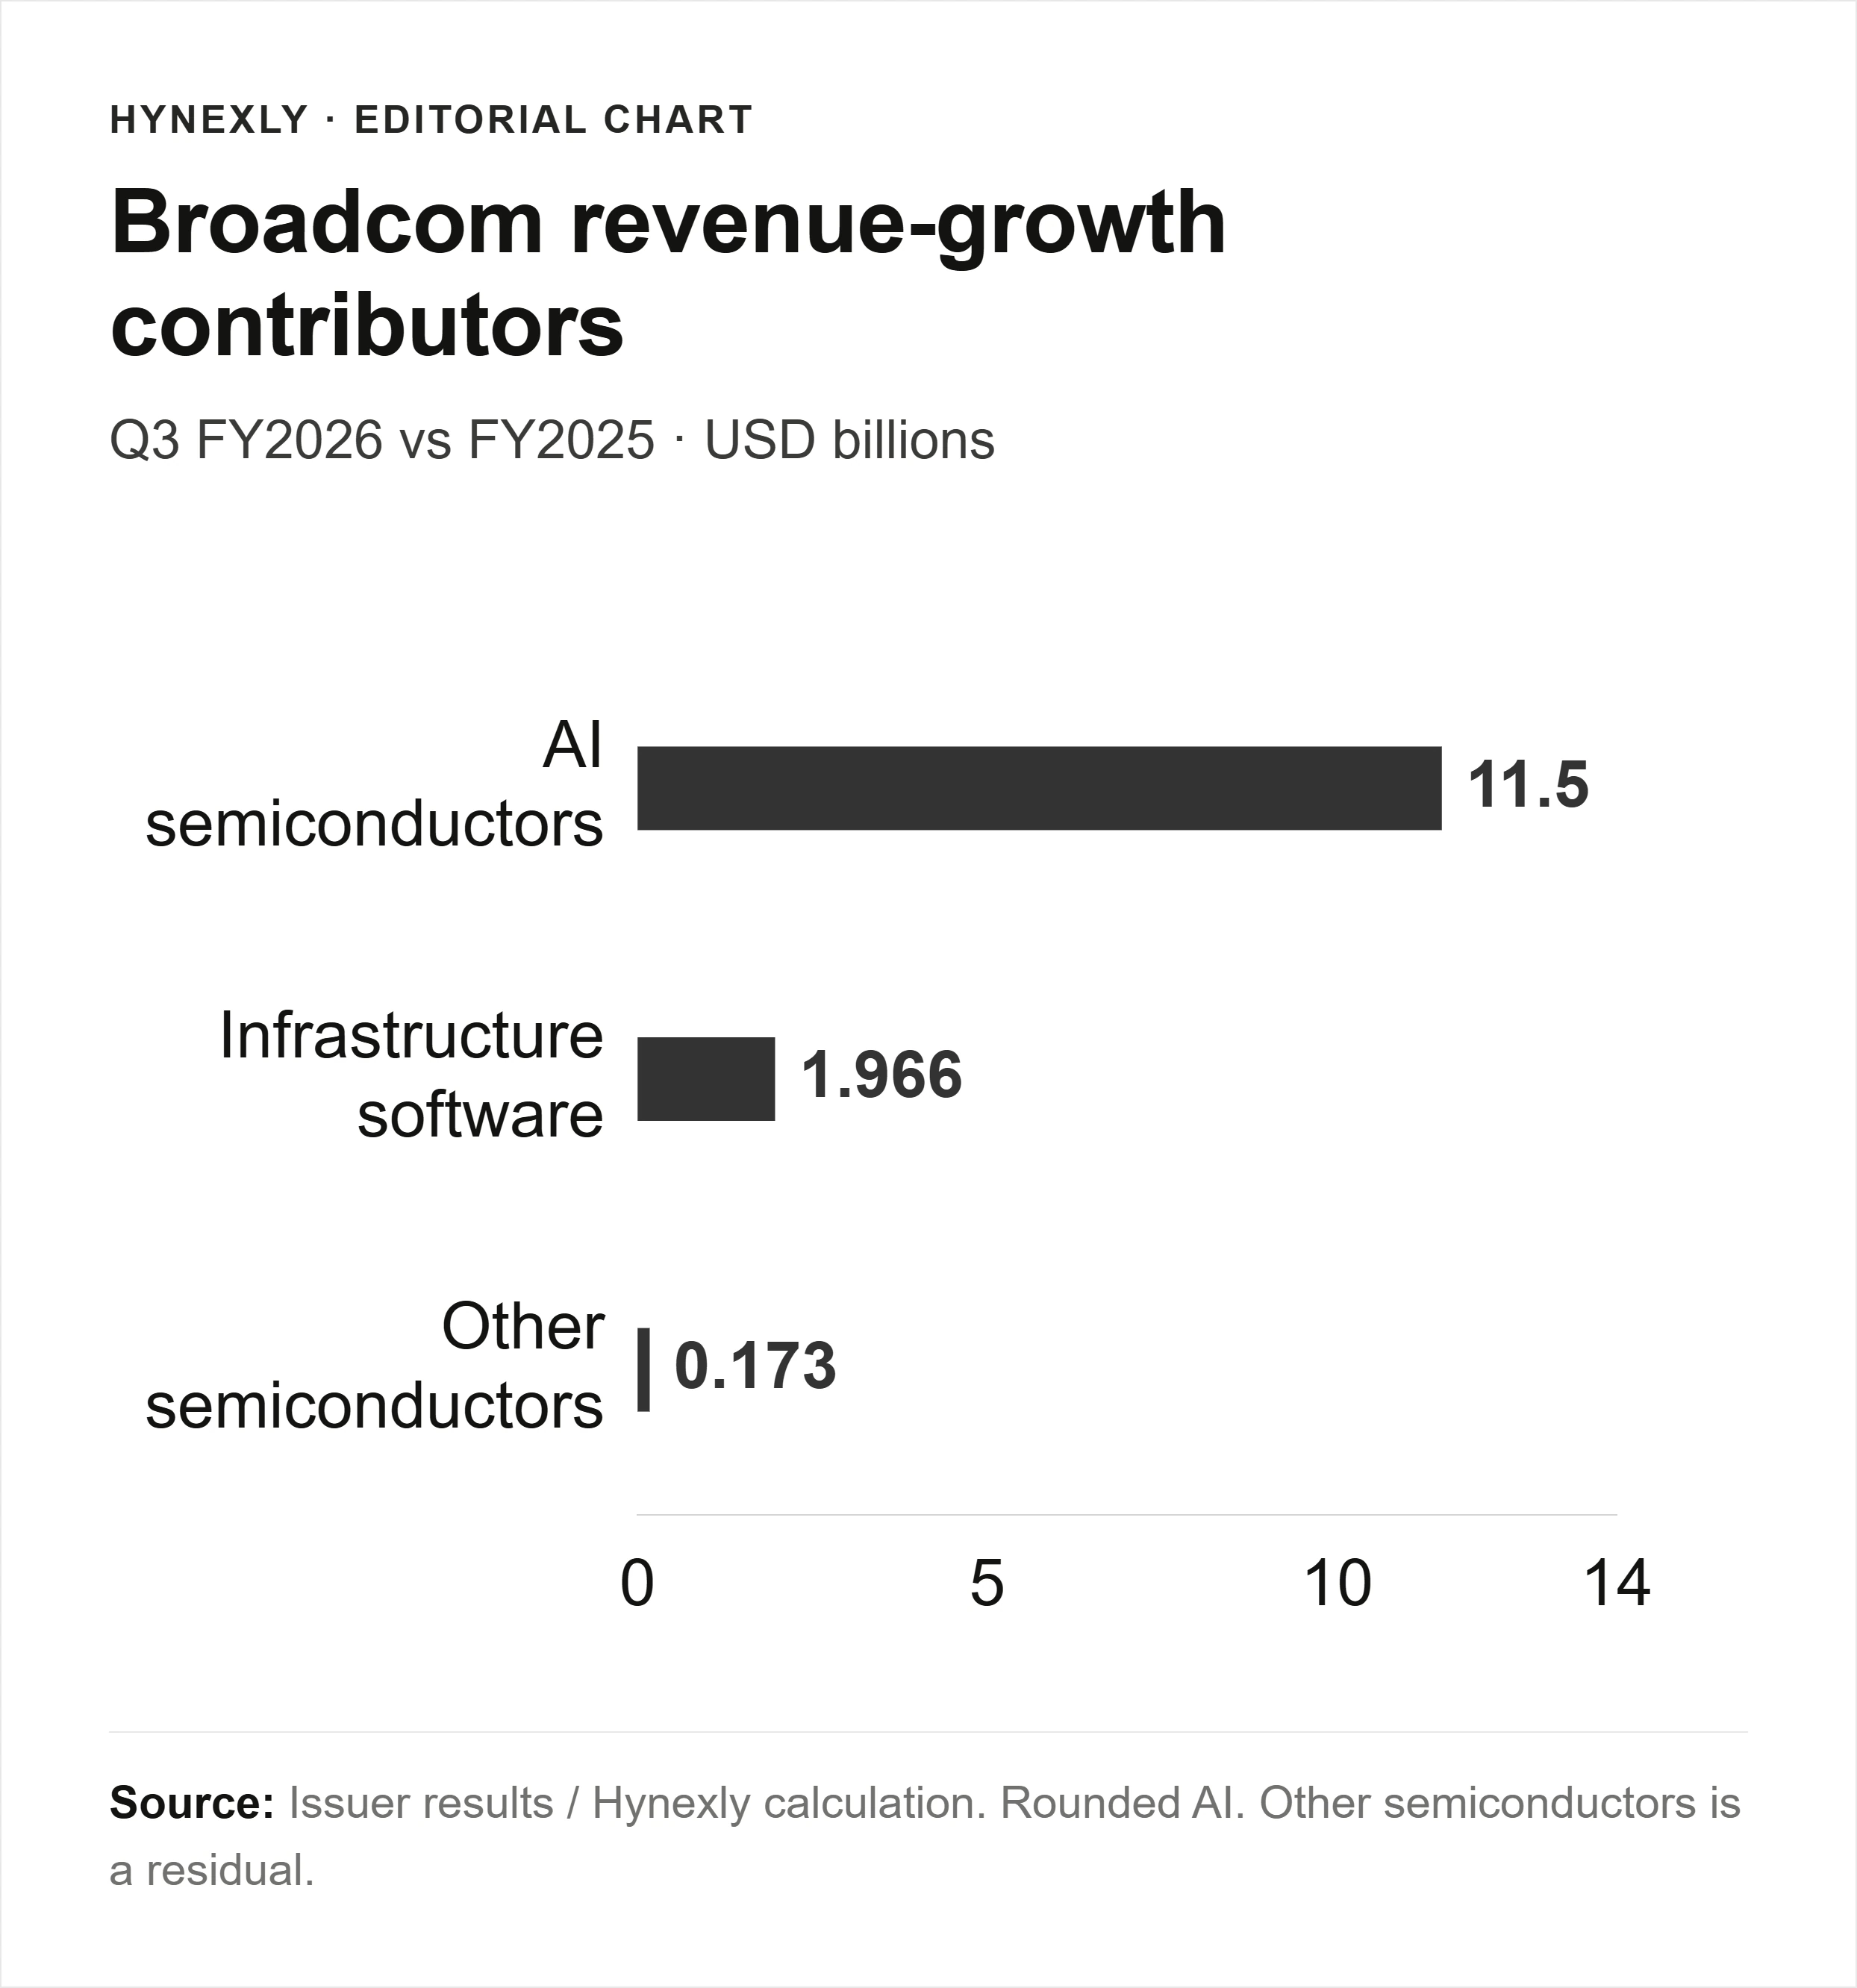
The residual is useful because it keeps “semiconductor growth” from becoming shorthand for improvement everywhere. It does not identify which non-AI products grew or declined. Offsetting changes can disappear inside a net figure.
The approximate contribution split is 84.3% AI, 14.4% software and 1.3% other semiconductors. The last decimal is not the conclusion. Allowing for rounding in the AI inputs puts its growth contribution around 83.6%–85.1%; it still supplied most of the increase.
Software deserves a closer look
Software is the largest source of growth outside AI. Before extending that growth into a forecast, open the revenue-recognition note.
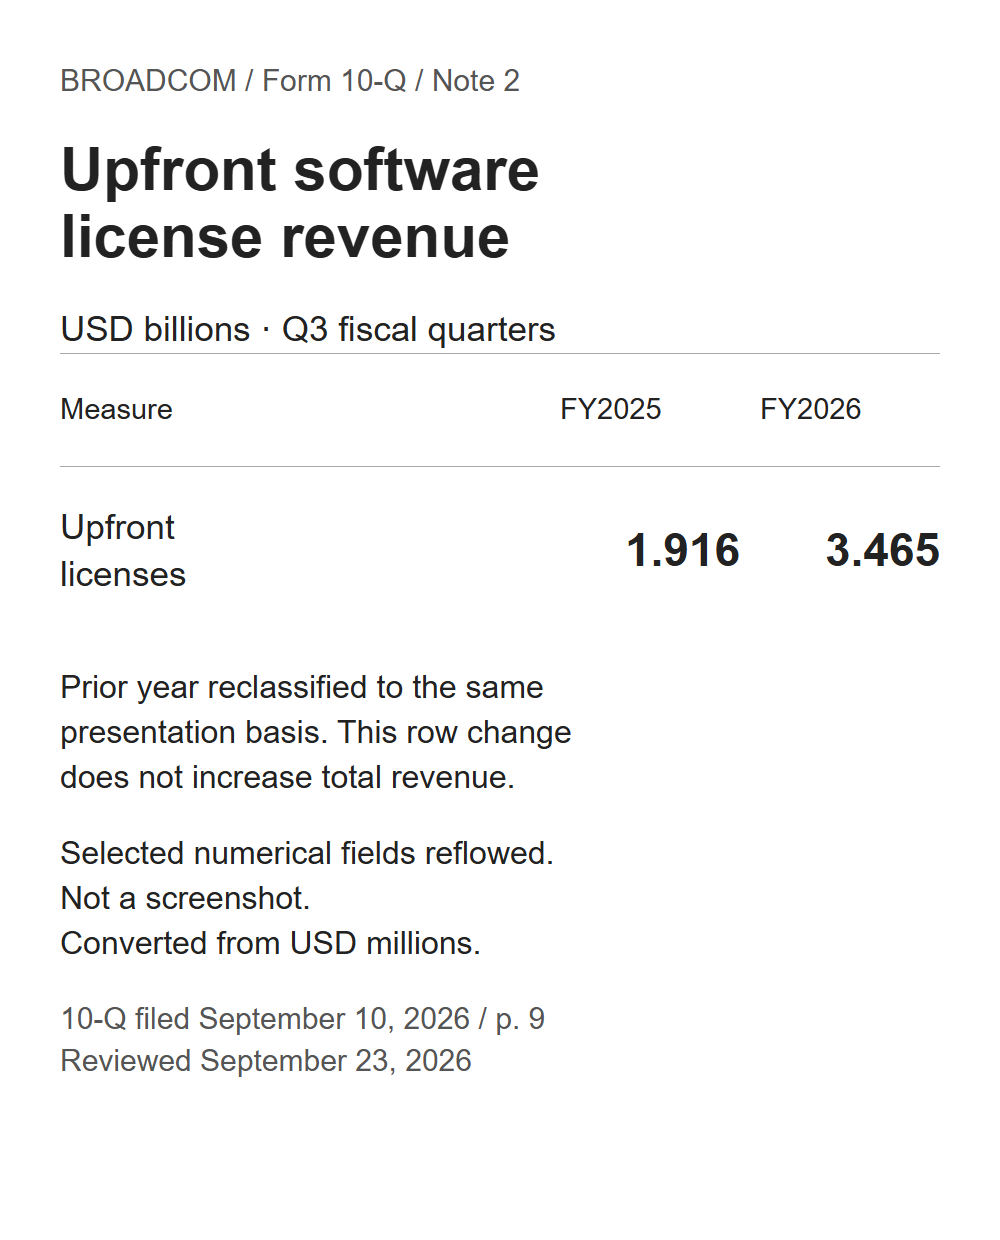
For software contracts without a termination-for-convenience provision, Broadcom records the license portion upfront when control transfers. Its filing also says most new software contracts no longer include that provision. That changes what a quarterly revenue comparison can tell us about continuing usage or future recognition.
| Q3 year-over-year software bridge | Increase |
|---|---|
Upfront-license revenue | $1.549B |
Remaining software revenue, calculated | $0.417B |
Total software segment | $1.966B |
Calculation: $3.465B − $1.916B = $1.549B; $1.966B − $1.549B = $0.417B. Inputs: the filing's Note 2 and segment table.
The license increase equals 78.8% of software's dollar growth. This is a reconciliation, not an estimate that contract changes alone caused that amount. New sales, renewals, deal sizes and terms can all affect recognized revenue; these fields do not isolate each cause.
Nor is this evidence of fictitious revenue. Moving license revenue from one income-statement row to another does not increase total sales. Booking a license upfront is a separate accounting question from collecting its cash. The practical mistake would be to call the full software increase a uniform recurring growth rate without checking the contracts.
A company forecast is not the market's expectation
Broadcom cleared its own earlier revenue forecast. That is a dated, testable comparison, not proof of a beat against Wall Street consensus.
| Q3 FY2026 measure | June 3 company forecast | Reported result |
|---|---|---|
AI semiconductor revenue | $16.0B | $16.7B |
Company revenue | $29.4B | $29.591B |
Sources: Q2 outlook and Q3 results. Forecast and result have the same fiscal period.
On September 2, management forecast Q4 AI revenue of $21.7B and company revenue of $34.8B, implying an AI share of about 62.4% if both occur. It also guided non-GAAP operating margin to 66%. These are company estimates for the quarter ending November 1, not a fresh September 23 forecast or a share-price valuation.
No independently verified current price or consensus is used here. We therefore cannot tell the reader that the growth is cheap, expensive or already priced in. The AI revenue reading guide offers the next useful step: keep reported sales and future targets separate before making a valuation comparison.
Strong cash is real; concentration is real too
The strongest countercase to an overly cautious reading is company cash generation. Broadcom's non-GAAP free cash flow rose to $13.665B from $7.024B in the year-earlier quarter. GAAP gross margin was 69% versus 67%, and operating income also rose sharply. This is not simply sales growth with nothing left over.
Those are company-wide results, however. They do not allocate cash to AI products or establish a product-level return. Customer exposure needs its own check.
| Share of company revenue | Q3 FY2025 | Q3 FY2026 |
|---|---|---|
One semiconductor distributor | 32% | 50% |
Top 5 end customers, estimated | About 40% | About 55% |
Source: Q3 Form 10-Q, MD&A. Quarter-only figures. Distributor and end-customer views overlap; do not add them.
A distributor is a route to customers, not necessarily the final buyer. Adding these shares would count overlapping exposure twice. The figures show sensitivity to a smaller set of commercial relationships, not a forecast of cancellations or unpaid bills.
What would make the growth look broader?
The next release and filing can strengthen or weaken this reading. A single headline growth rate will not settle it.
| Next check | What would change the interpretation |
|---|---|
AI and remaining semiconductors | Faster growth outside AI would broaden the current contribution pattern. |
Software recognition | Growth beyond the upfront-license increase would make the recurring-growth argument easier to examine. |
Cash and concentration | Sustained cash generation with less concentrated exposure would strengthen the durability case. |
Repeatedly narrow growth, weaker cash or rising concentration would push the other way. None alone proves the thesis has failed; the useful comparison follows the same periods and definitions. The AI-company comparison explains why another company's larger headline number may measure a different business altogether.
How the calculation can be repeated
All subtraction uses USD billions before rounding. AI growth is $16.7B − $5.2B. Software growth is $8.752B − $6.786B. Other semiconductor revenue is the reported semiconductor segment less AI in each period: $20.839B − $16.7B now and $9.166B − $5.2B previously.
The rounding range assumes each reported AI amount was rounded to the nearest $0.1B. Divide the resulting $11.4B–$11.6B increase by the $13.639B company increase. This is a rounding illustration, not a confidence interval or a forecast.
Primary documents reviewed September 23, 2026: Q3 FY2026 results, Q3 Form 10-Q, Q3 FY2025 results and Q2 FY2026 results. This update replaces the earlier Q2 checkpoint; the original publication date is retained.
AI assisted production; Hynexly is responsible for the review. No Broadcom sponsorship. General information, not individualized investment advice, a rating or a price target.
Frequently Asked Questions
About 56.4%, calculated from reported AI revenue of $16.7B and total revenue of $29.591B. Both refer to the quarter ended August 2, 2026.
No. AI contributed about $11.500B of the $13.639B year-over-year increase, software $1.966B, and the calculated non-AI semiconductor remainder about $0.173B.
No. Revenue recognition follows the accounting rules and contract terms; cash collection is a separate measure. The license comparison does not isolate how much demand or contract changes caused growth.
Primary references cited or linked in this analysis. Click through to read each source in full.
Choose the next evidence gap to investigate.
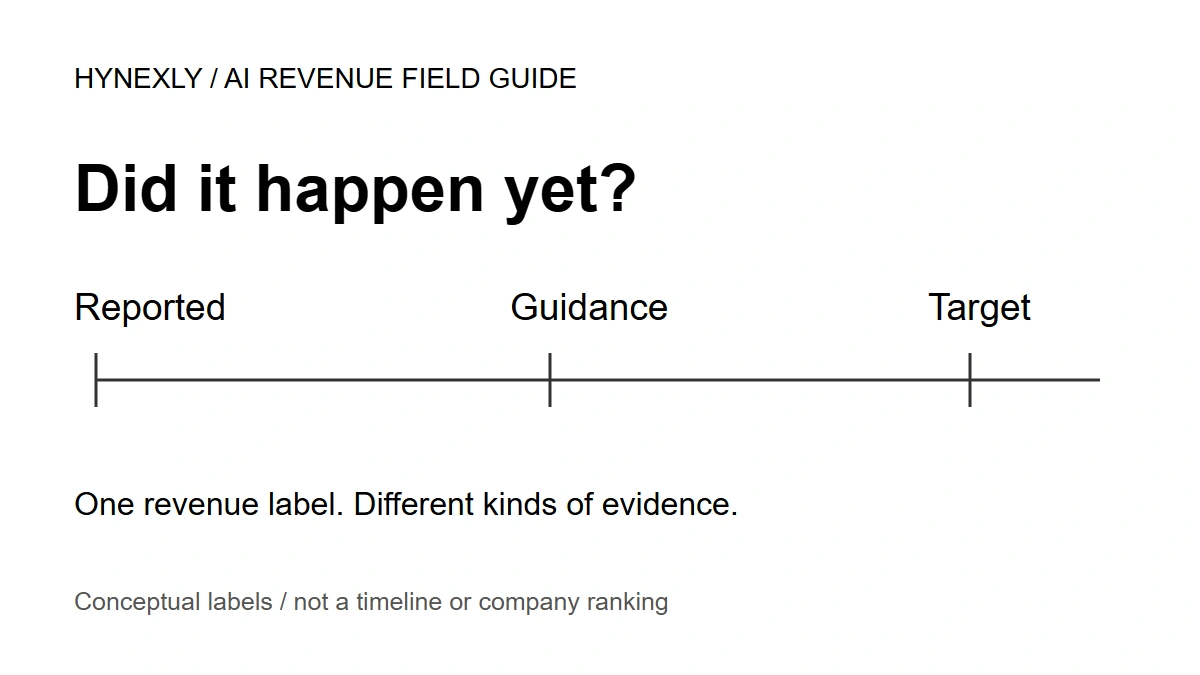
Is That AI Revenue—or a Forecast?
A practical guide to AI revenue claims: test Broadcom's forecast against its result, repair NVIDIA's growth comparison and keep Qualcomm's target in context.
Owner-operated US market research desk
Owner-operated US stock and market coverage built from public filings, SEC EDGAR, official reports, company releases, and market data.
- Source-grounded research with primary filings & official reports
- Bilingual EN / KO editorial workflow
- Manual editorial QA before publish