Nvidia's cash quarter was real. Repeating it was another question.
Nvidia's Q1 FY2027 cash flow covered substantial investment and repurchases. Tax timing, share issuance and the completed Q2 result show why it was not a permanent run rate.
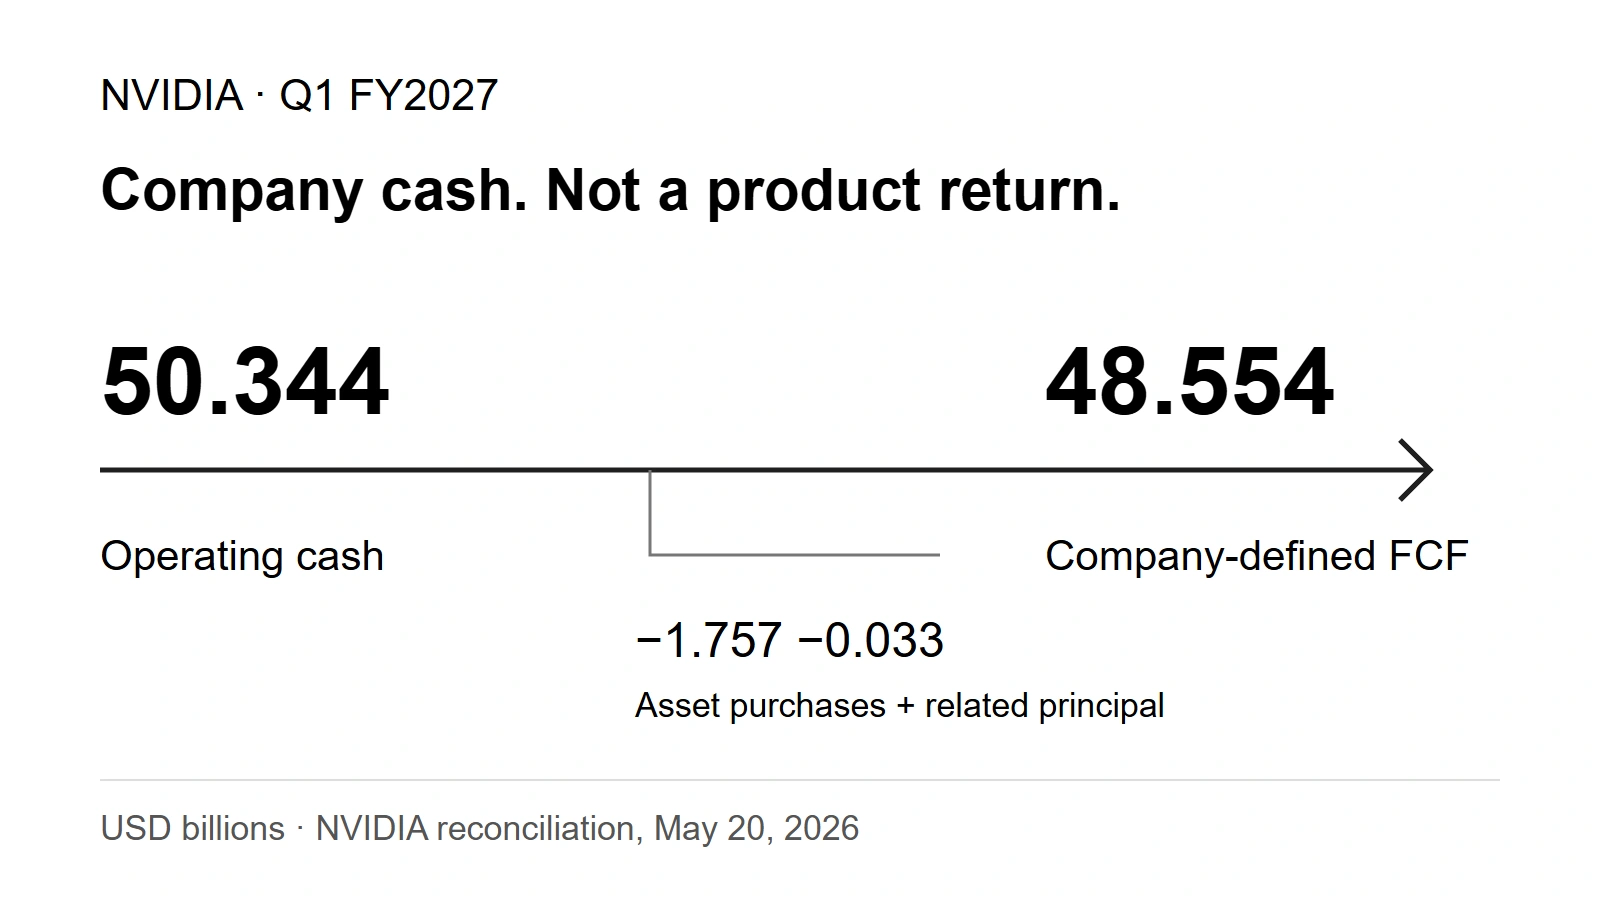
A strong result, with a boundary already in the filing
Nvidia generated plenty of cash during the first quarter of fiscal 2027. The harder claim was that Blackwell, its AI computing platform, would keep producing cash at that pace. The published accounts supported the first statement, not the second.
For the quarter ended April 26, 2026, Nvidia reported $48.554B of free cash flow (FCF): operating cash after specified equipment, intangible-asset and related principal payments. These are company-wide accounts, not a Blackwell project cash-flow statement.
This page is the historical Q1 baseline, reviewed on September 23, 2026. The Q2 report is already available. Its lower cash conversion narrows the conclusion: the strong quarter happened; a stable quarterly run rate was never established.
Follow the cash definition before the growth rate
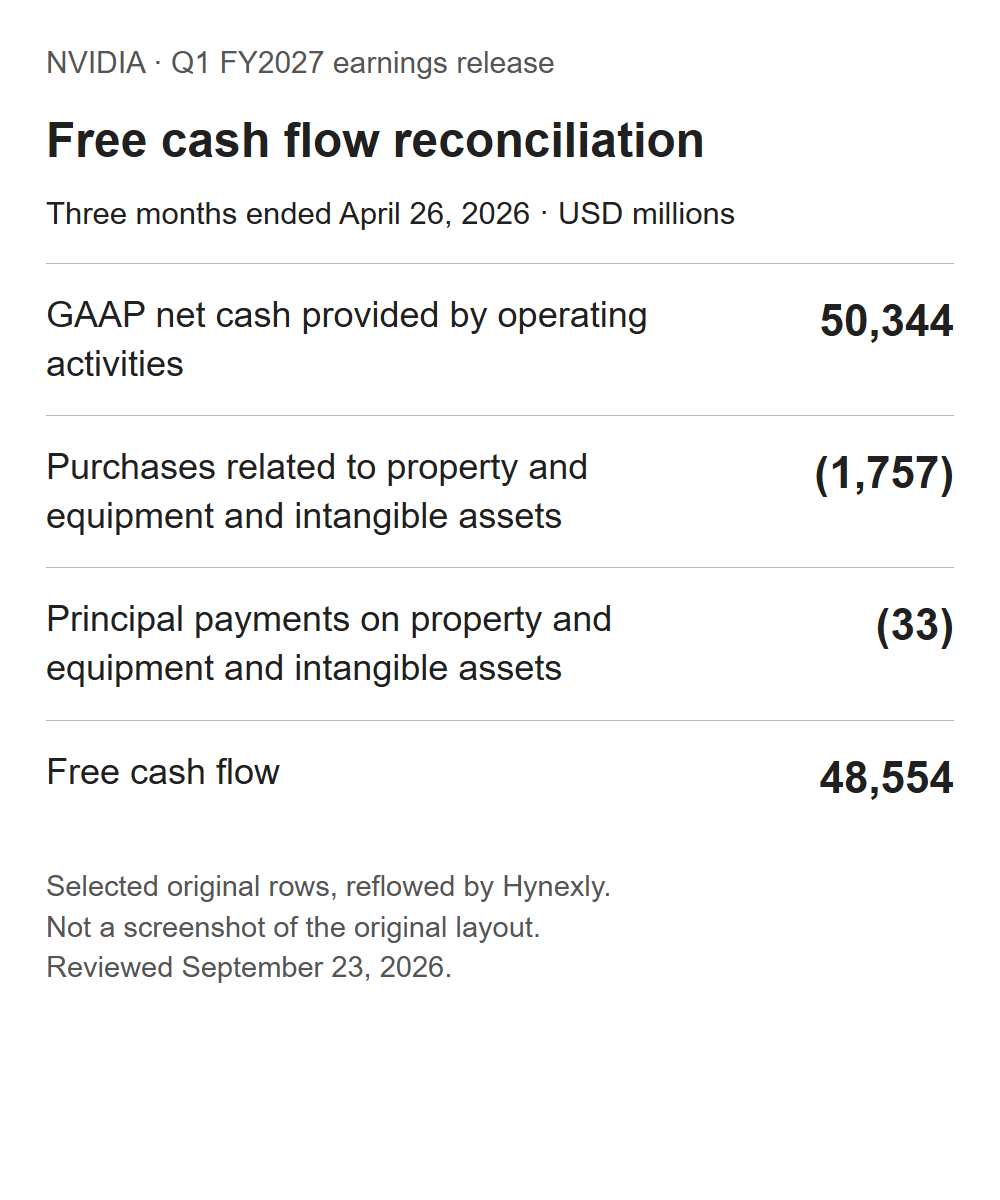
Revenue and company-defined free cash flow grew at almost the same annual pace. Revenue rose 85.2%; free cash flow rose 85.8%. Cash left after the specified deductions therefore kept up with sales, a stronger result than growth in accounting earnings alone.
The comparable margin barely moved: 59.3% of revenue a year earlier, versus 59.5% in Q1. This ratio describes the whole company. It does not mean that customers paid that fraction of this quarter's invoices, or that a Blackwell system earned that return.
There was also an unusually favorable payment calendar. In the Q1 filing's liquidity discussion, Nvidia disclosed that it made no federal income tax payments during Q1 and expected two in Q2. That means US federal income tax, not every kind of tax. It gives a reason to distrust a simple annual extrapolation without supplying a dollar amount for a homemade “normalized” quarter.
Payment timing changes cash available now, not the eventual obligation.
Free cash flow is not the change in the bank balance
Free cash flow is an intermediate measure, not money left after every investment and shareholder payment. The cash-flow statement records substantial uses outside the company's definition.
| Q1 FY2027 measure | Amount | What it measures |
|---|---|---|
Company-defined free cash flow | $48.554B | Operating cash after specified asset and principal payments |
Cash payments related to share repurchases | $19.312B | Cash-flow statement financing outflow |
Purchases of non-marketable securities | $18.582B | A separate investing outflow, not deducted in the FCF definition |
The cash repurchase payments were covered about 2.51 times by free cash flow. Subtracting those payments leaves $29.242B arithmetically. It is not a reported retained-cash balance: securities purchases, dividends and other movements still matter.
An earlier version compared FCF with the filing's rounded $20.2B gross repurchase amount and called that amount a cash outlay. The revised comparison uses the actual cash-flow line. The equity statement records $20.170B of repurchases, while the cash statement records $19.312B of payments. Different statements answer different questions; neither figure should silently replace the other.
The quarter funded several uses, not necessarily every future expansion commitment.
Buying shares is not the same as removing that many shares
Share counts test what repurchase dollars cannot.
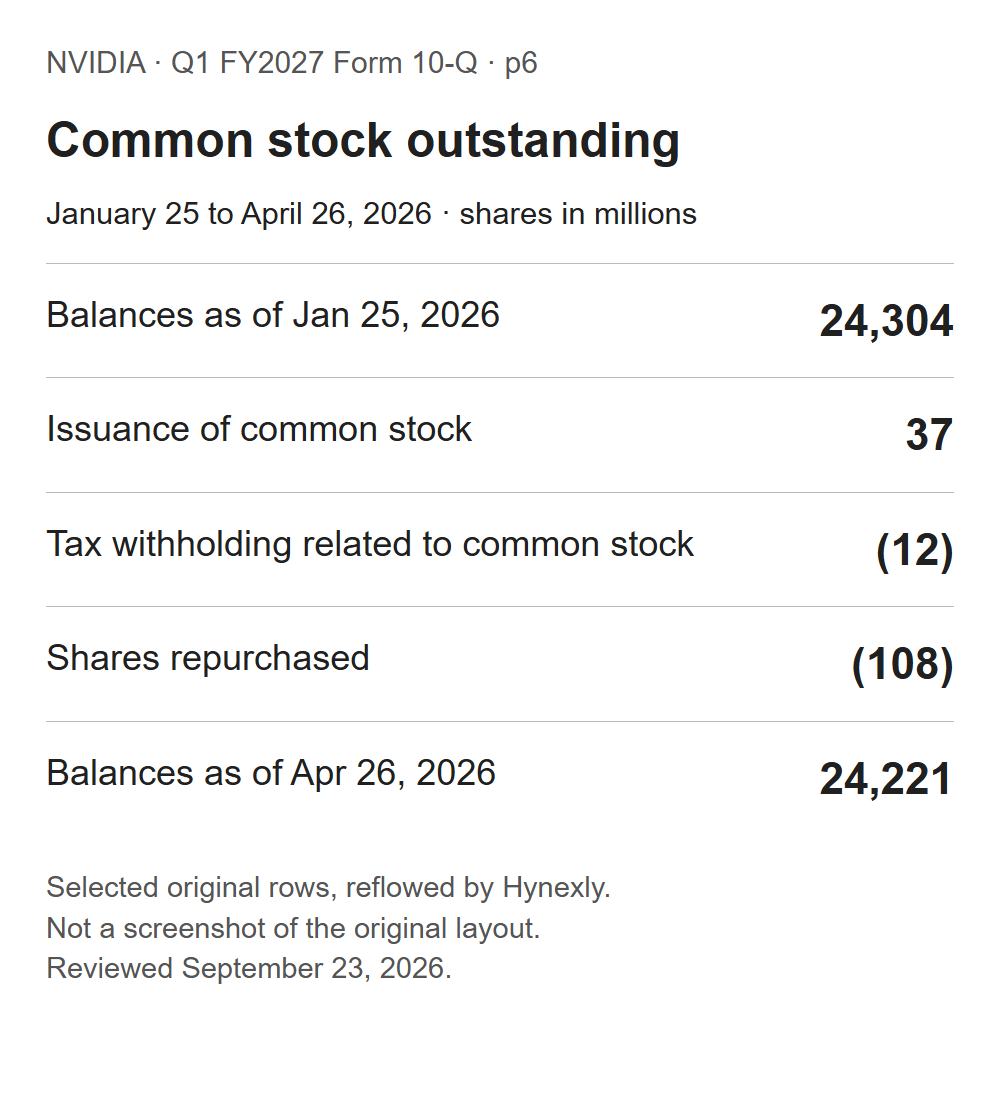
Nvidia repurchased 108M shares on this rounded statement, but issued shares during the same period. The reconciliation is 24,304M + 37M − 12M − 108M = 24,221M. The negative withholding row also removes shares; it is not additional issuance.
Net shares therefore fell by 83M, or about 0.34% of the opening count. That is real shrinkage, just less than the gross repurchase number. This is an end-of-period share count, not the weighted-average diluted denominator used to calculate earnings per share.
Can net shares keep declining while business needs are funded? Coinbase's buyback analysis tests a different issuance pattern. Spending alone proves neither stock was cheap.
Inventory grew with sales, but raw materials moved faster
The Q1 inventory build did not by itself demonstrate failed demand. Total inventory increased roughly in line with quarterly revenue. Its composition was less comfortable.
| Inventory balance | January 25, 2026 | April 26, 2026 |
|---|---|---|
Total inventory | $21.403B | $25.797B |
Raw materials | $3.807B | $6.647B |
Source: Q1 Form 10-Q, inventory note, p13. USD billions; these are point-in-time balances, not quarterly expenses.
Total inventory rose 20.5%, compared with 19.8% sequential revenue growth. Raw materials rose 74.6%. Building components ahead of delivery can support expansion, but it also leaves more capital exposed if customer deployment or product plans change.
The cash-flow inventory adjustment was a $4.420B use of cash. It is already inside operating cash flow and must not be subtracted again when computing FCF. Nor is it identical to subtracting the two balance-sheet amounts.
There was constructive counterevidence: inventory provisions, the expense for expected inventory losses, were $0.8B against $2.3B a year earlier. A larger stock of components had not produced the same expense pattern. That is a reason to monitor the build, not label every extra component unsold or obsolete.
The stock question is durability, not a multiple invented here
A valuation built on one strong cash quarter needs that cash to be repeatable. This article has no matched-date current price or independently verified consensus, so it does not claim what a precise share price implies or offer a valuation verdict.
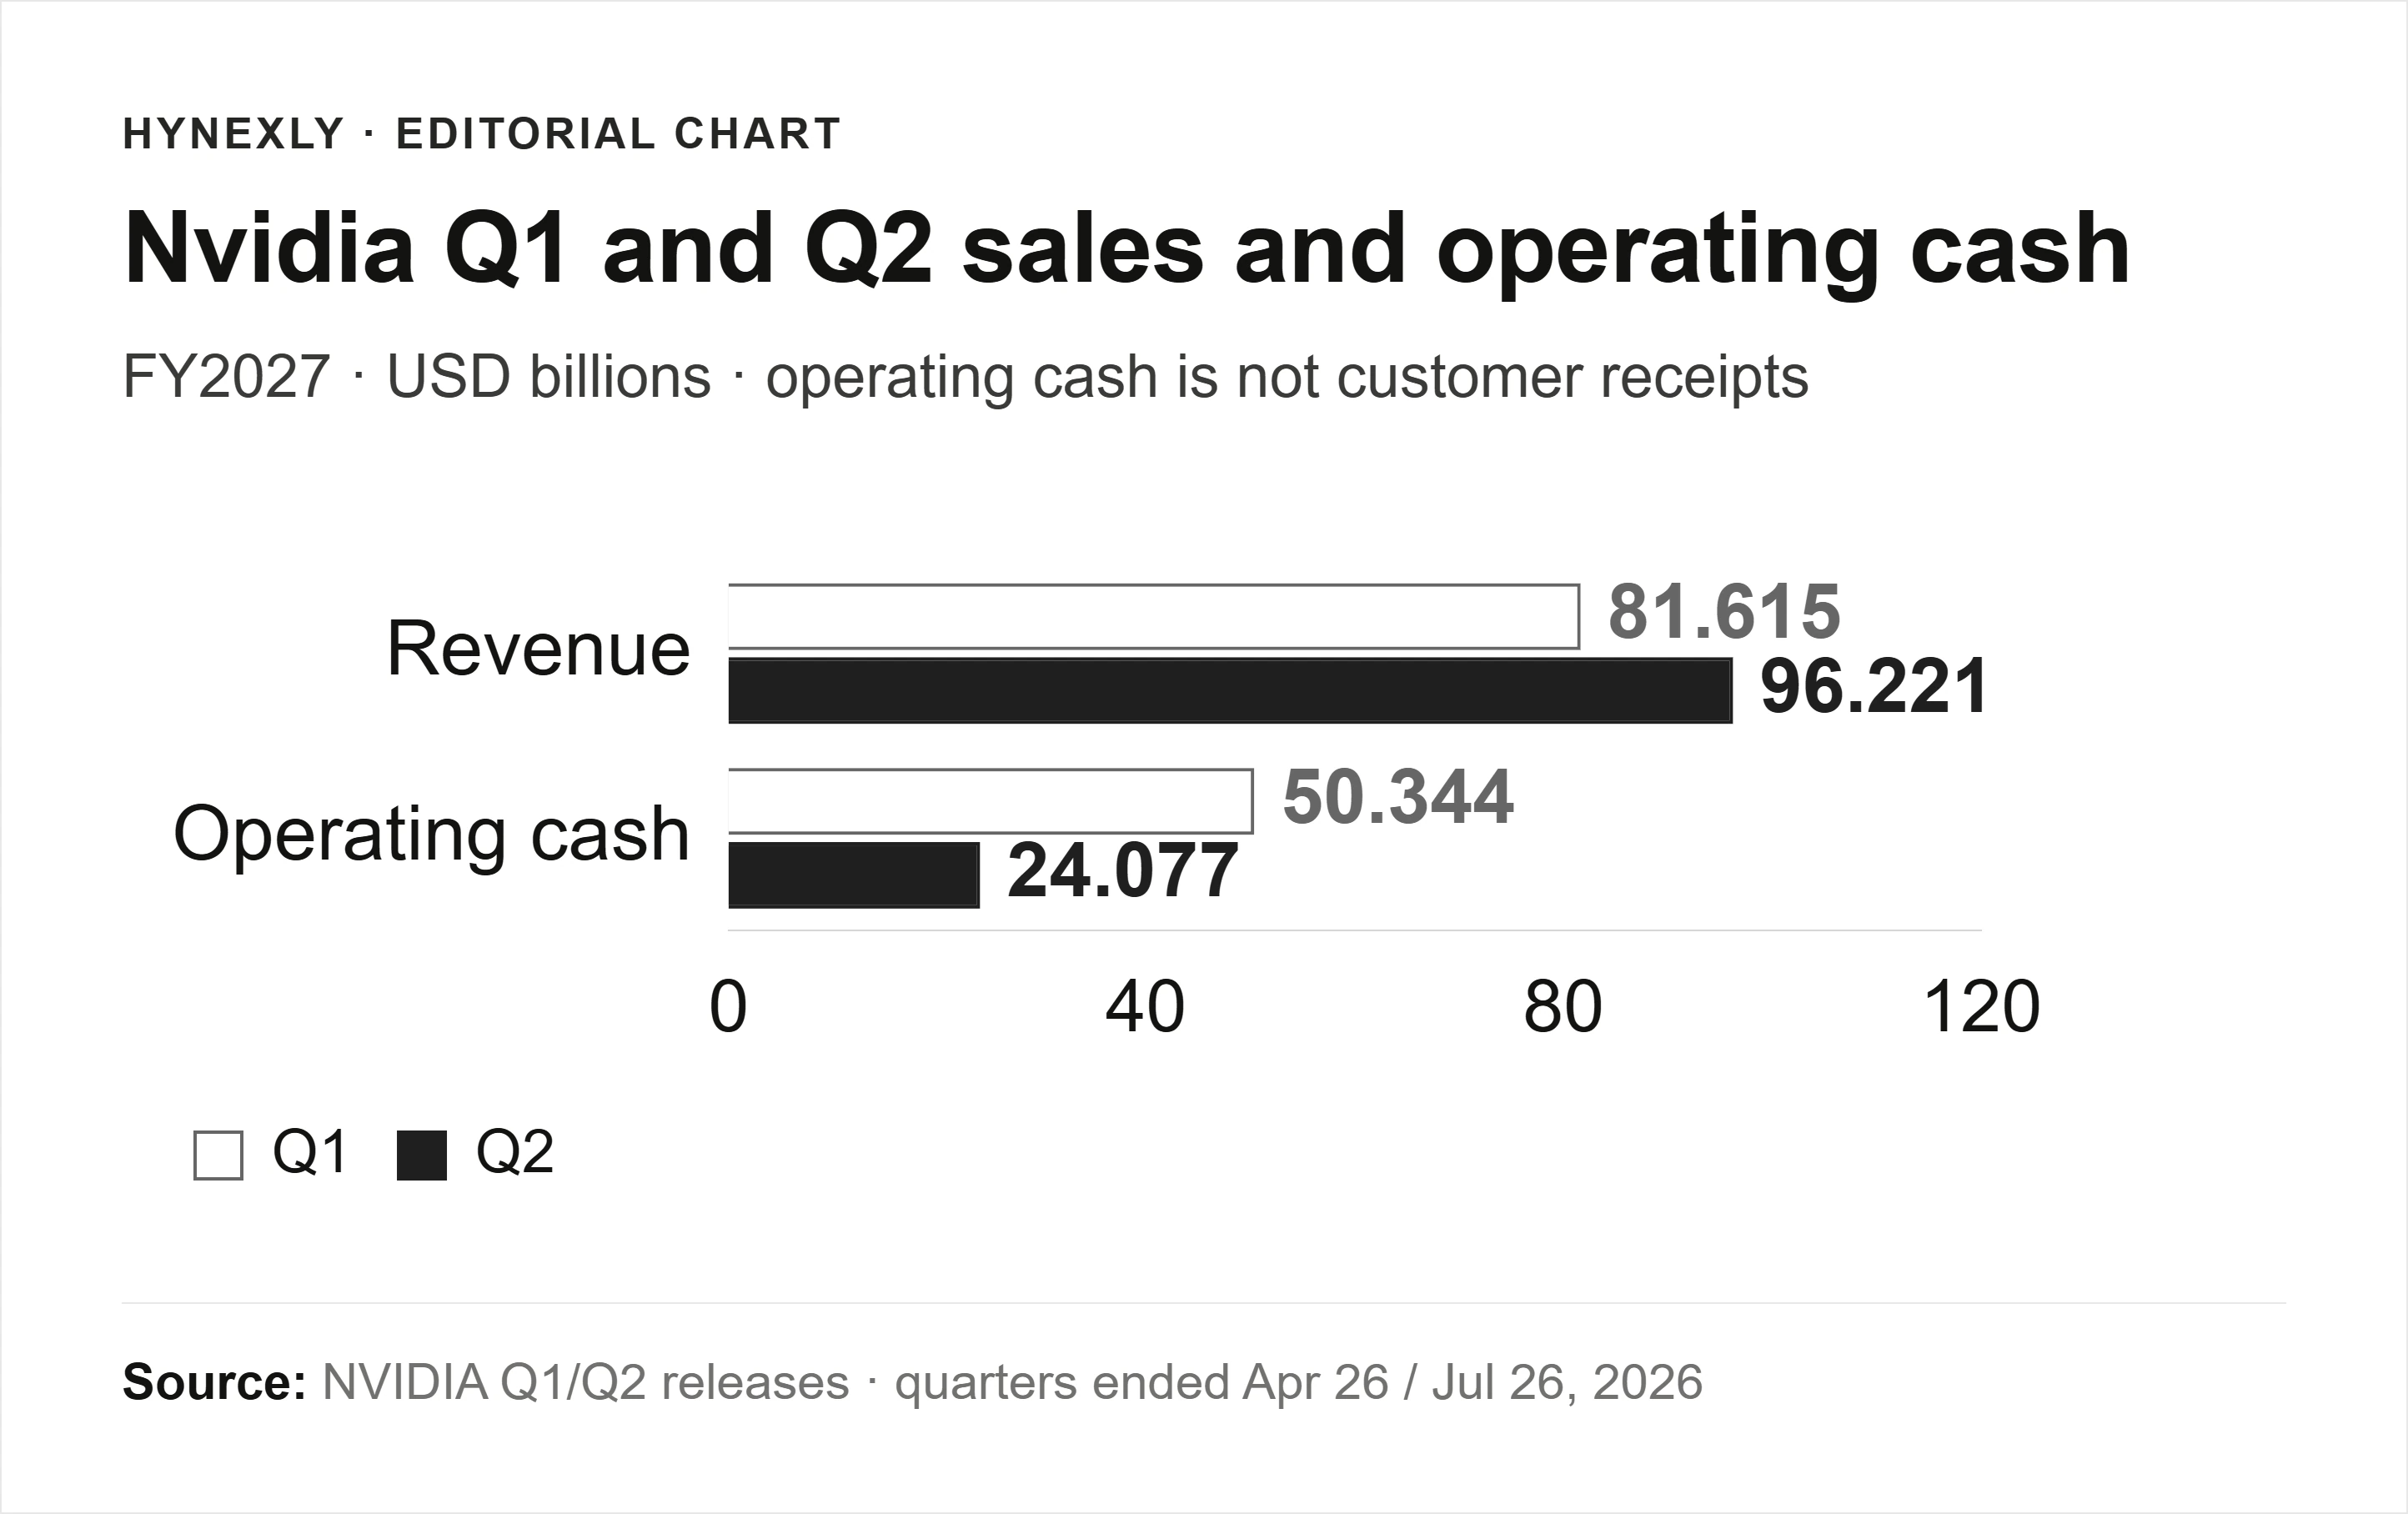
The operating comparison is observable. In the completed Q2 release, revenue rose to $96.221B while company-defined FCF fell to $21.341B. FCF/revenue dropped to 22.2%.
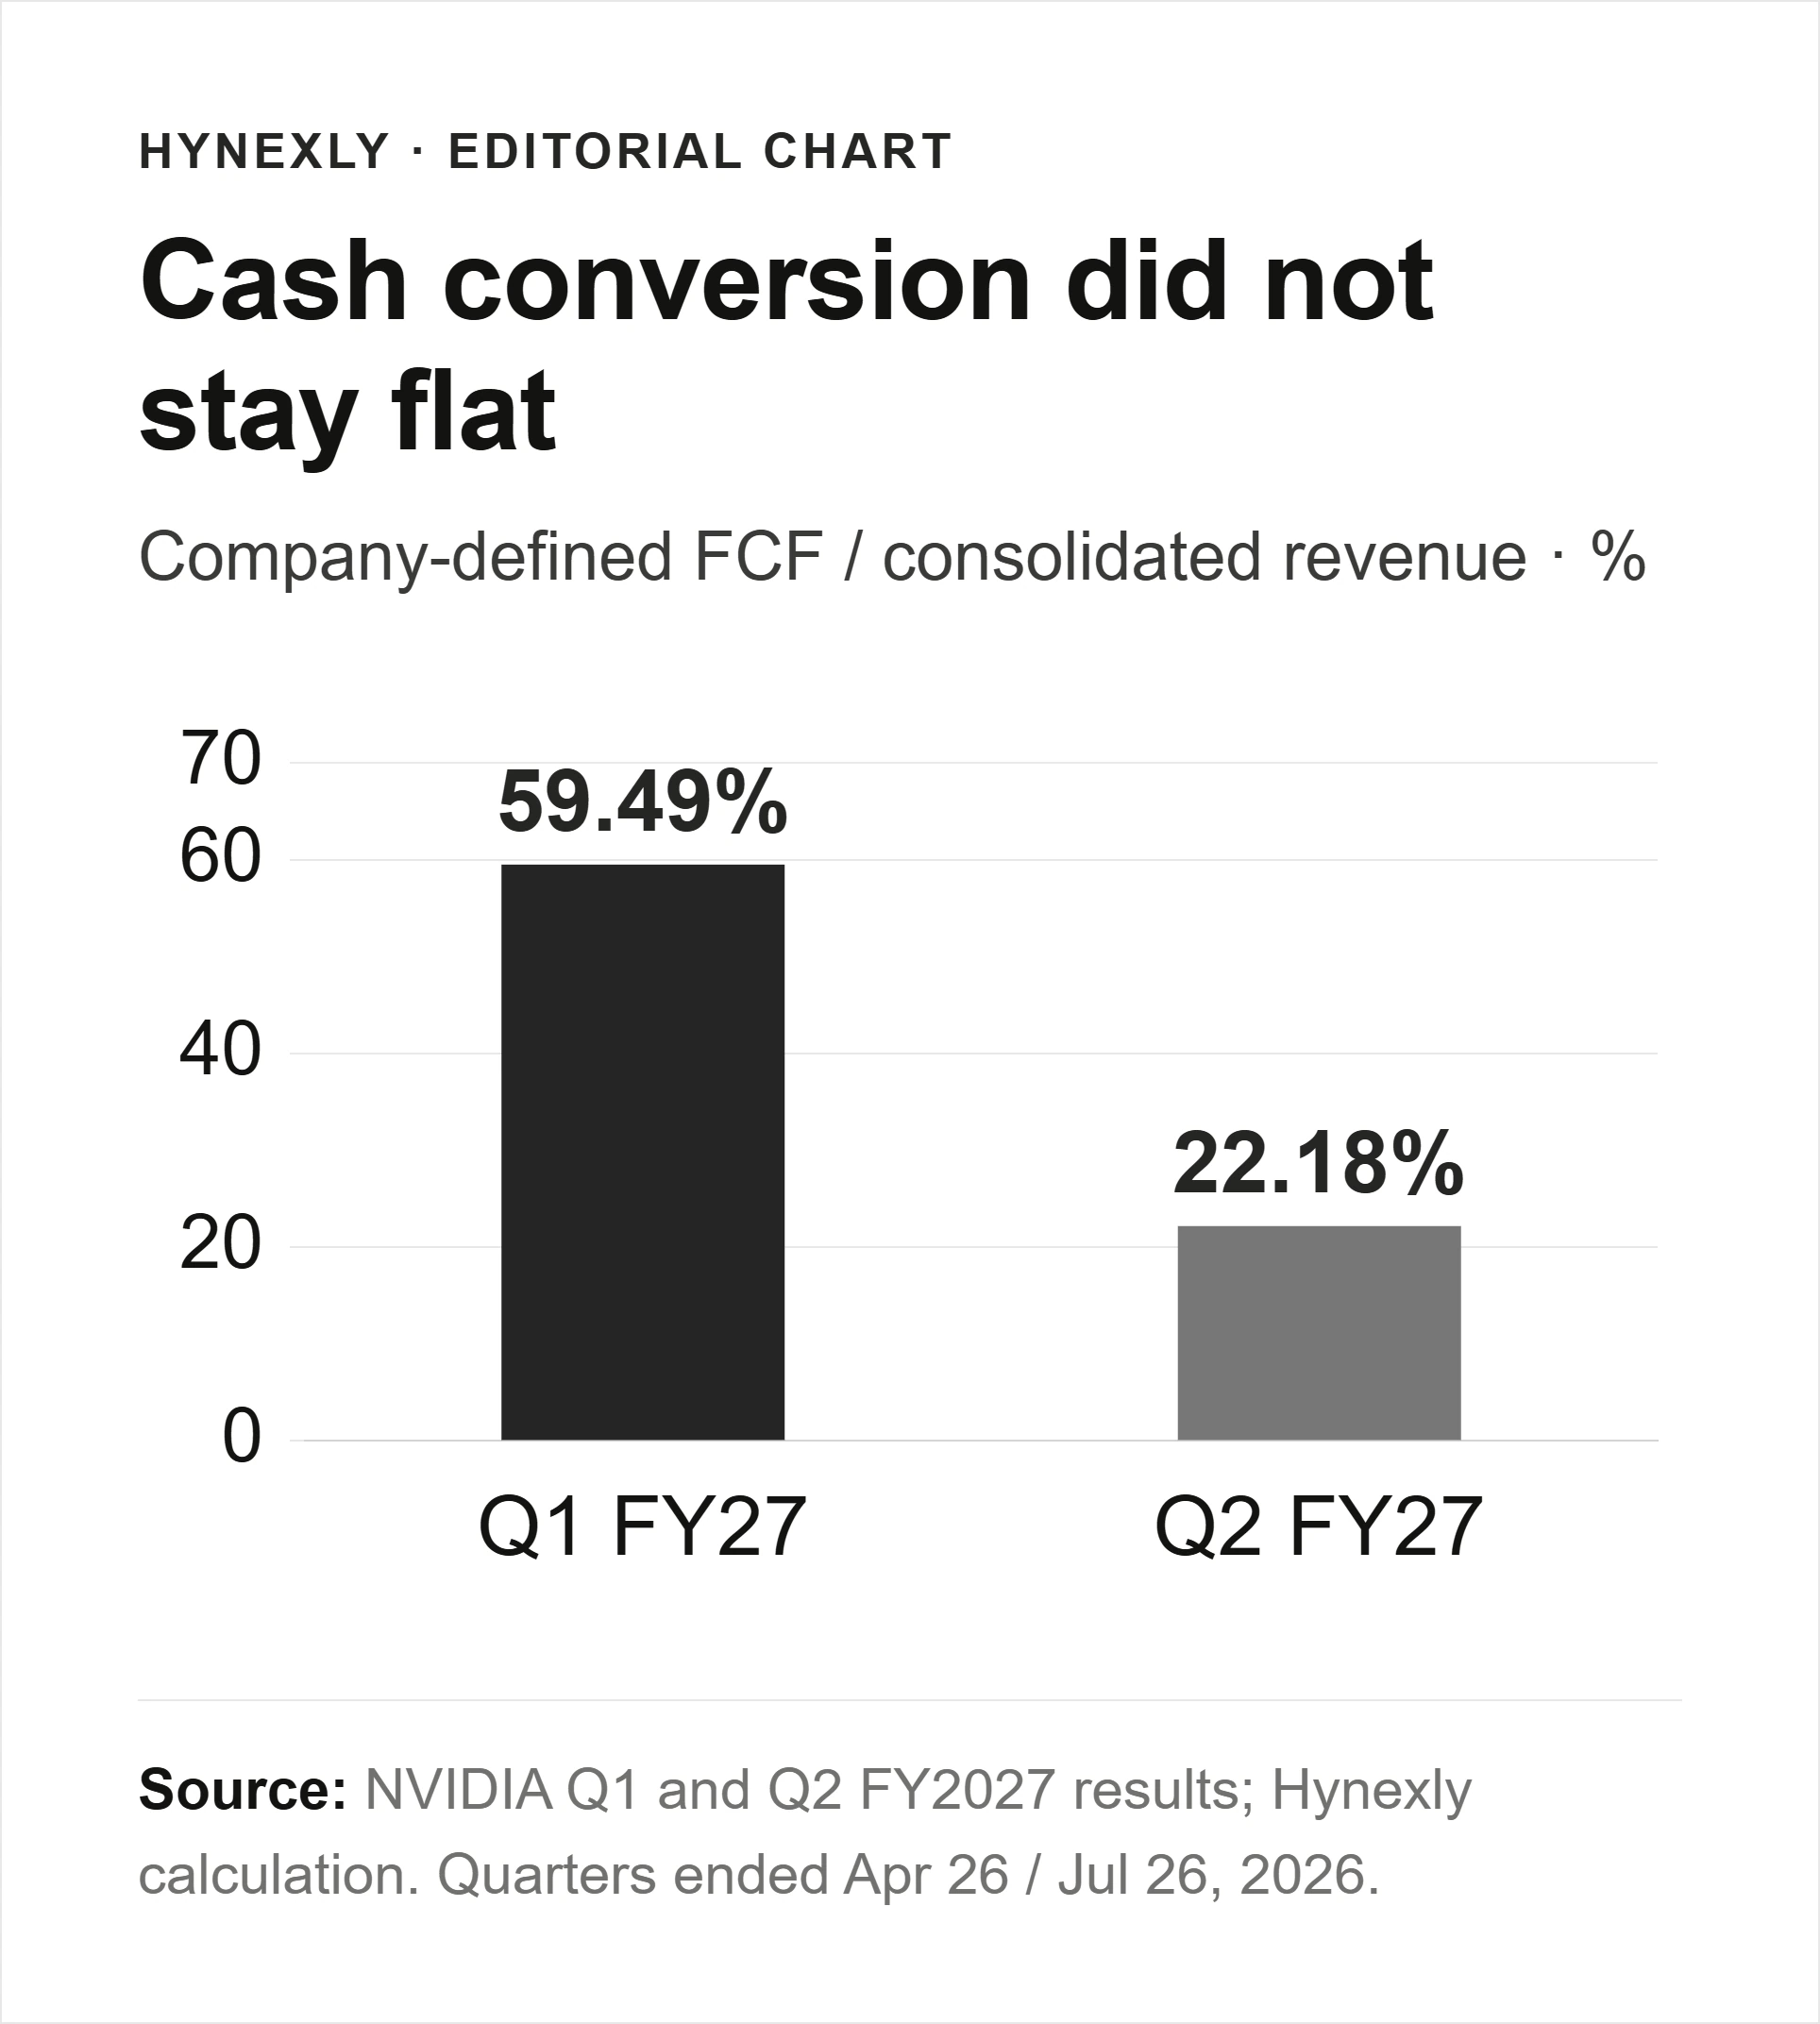
That is the important historical turn. Q1's strong conversion did not persist sequentially. Yet Q2 FCF was still 58.7% above the prior-year Q2 result. A lower sequential ratio and a larger annual cash result can both be true.
Two ways to misread the next quarter
The first is to excuse every cash shortfall as timing. Delayed collection still consumes funding capacity. If receivables and inventory keep rising without subsequent cash collection, the claim that growth finances itself becomes less convincing.
The second is to treat a lower cash quarter as proof that the business stopped working. Taxes, customer payment terms and investment cycles can move cash between quarters. A recovery supported by collection and stable inventory quality would weaken a lasting-deterioration argument.
Neither risk is resolved by looking only at revenue. Nor can the difference between two cash totals be assigned entirely to tax payments without the separate evidence.
Carry the test forward, not the old conclusion
| Next Q3 filing check | Evidence that strengthens durability | Evidence that weakens it |
|---|---|---|
Cash collection | Receivables convert into cash as sales grow | Receivables absorb more cash without later collection |
Payment timing | Disclosed tax and payment movements explain a recovery | Repeated shortfalls are dismissed without a reconciliation |
Inventory quality | Sales absorb inventory without worsening provisions | Components and provisions rise while sales slow |
Share count | Net shares decline alongside sufficient operating cash | Gross repurchase headlines mask persistent net issuance |
These are directional checks, not company guidance or arbitrary trading thresholds. The next source is the Q3 earnings report and filing; no unconfirmed event date is assumed.
The current Q2 cash investigation takes the next step: which cash-flow lines changed, and how that sits beside future commitments. This Q1 page remains the starting measurement, not a competing current-results story.
Method and disclosure
Hynexly recalculated the same-definition figures from the cited original tables. Q1 FCF is 50.344 − 1.757 − 0.033 = 48.554; Q2 is 24.077 − 2.677 − 0.059 = 21.341, in USD billions. FCF/revenue is 48.554 / 81.615 = 59.49% and 21.341 / 96.221 = 22.18%. Growth rates use unrounded inputs before display rounding; the share bridge uses the filing's rounded million-share rows.
The September 23, 2026 revision removes stale market overlays and future-Q2 language, distinguishes repurchase cash from equity accounting, and adds the original tax-timing boundary. AI assisted research organization, drafting, bilingual editing and deterministic visual production. Source rows and arithmetic were checked in this workflow; this is not a claim of independent human review. Korean prose has a separate recorded editing pass. No Nvidia sponsorship or affiliate relationship is declared; the author's personal holding status is not verified here. This is general information, not personalized investment advice.
Primary references cited or linked in this analysis. Click through to read each source in full.
Choose the next evidence gap to investigate.
Nvidia's Sales Grew. Why Did Operating Cash Flow Halve?
Nvidia's Q2 sales rose while operating cash fell. A $20.1B increase in receivables-related cash use explains much of the gap, without proving customer default.
Owner-operated US market research desk
Owner-operated US stock and market coverage built from public filings, SEC EDGAR, official reports, company releases, and market data.
- Source-grounded research with primary filings & official reports
- Bilingual EN / KO editorial workflow
- Manual editorial QA before publish