Goldman Sachs: More Revenue, a Smaller Share
Goldman's financing-and-fee revenue grew while its share fell. The four underlying lines explain more about Q2 earnings quality than a mix threshold does.
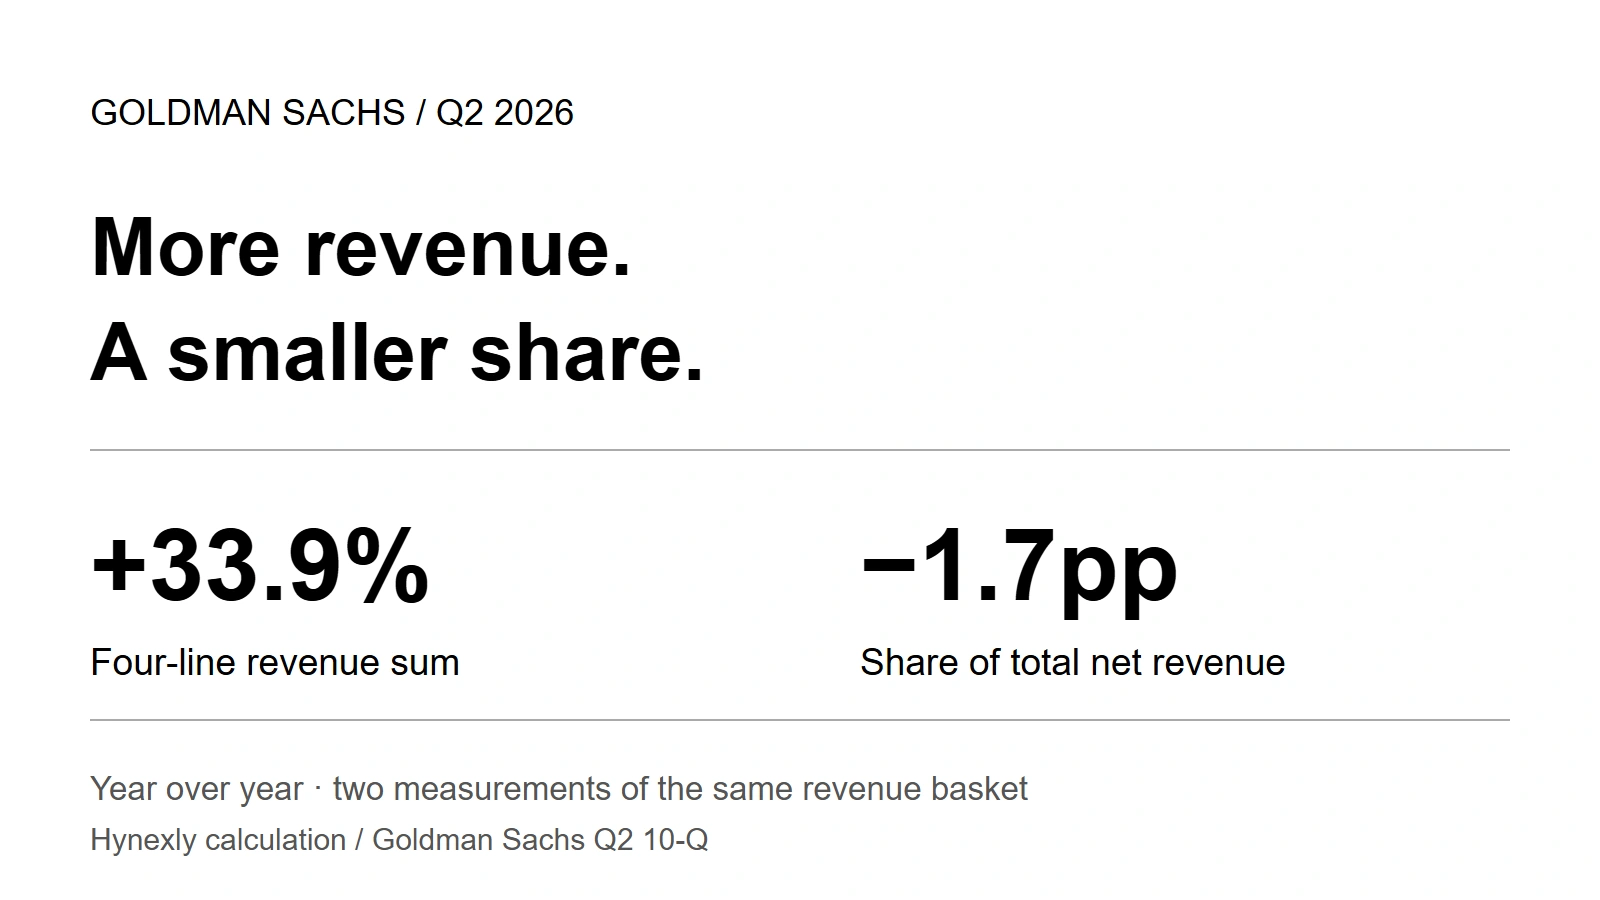
Goldman's financing-and-fee revenue grew 33.9%, yet its share of total revenue fell 1.7 percentage points. That is not a contradiction. The rest of the business grew faster. To judge whether earnings became more dependable, start with the dollars inside that percentage.
The share is the wrong place to stop
The useful question after a strong quarter is what can keep earning when client activity slows. Goldman groups selected financing and fee businesses as more durable in its annual report. Adding those lines gives a way to follow them, but not a certified amount of recurring profit.
The distinction changes the reading of Q2. Growth was real and large; it was also uneven. Equities financing provided most of the increase, while private banking and lending went backward. A single mix percentage conceals both facts.
Financing is already inside the markets business
Global Banking & Markets, or GBM, supplied 93.6% of Goldman's year-over-year revenue increase. That concentration deserves attention. But GBM includes financing as well as trading-related intermediation, advisory and underwriting. Calling the whole division a temporary trading boost would discard part of the evidence.
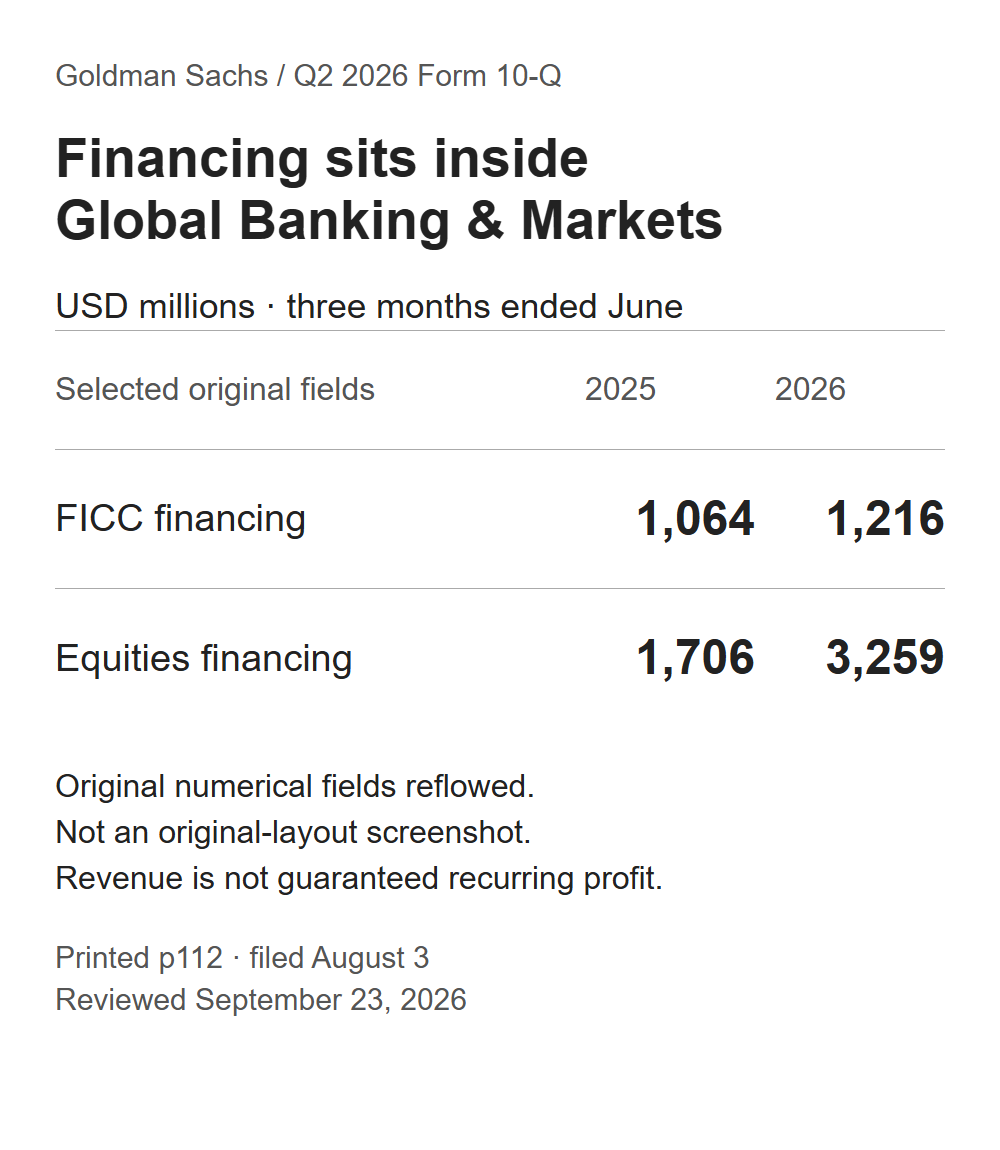
Source evidence: Q2 Form 10-Q, printed page 112, filed 2026-08-03, reviewed 2026-09-23. Selected original numerical fields reflowed for readability; not an original-layout screenshot. Three months ended June; USD millions. The rows establish revenue, not future recurrence.
Financing here includes lending against assets, providing funds for client portfolios and lending securities. It is still exposed to client demand, funding conditions and risk. The filing's business definitions, pages 111–112, do not describe a fixed subscription.
The two financing lines added $1,705M. That was 31.7% of GBM's $5,387M increase. This calculation does not make GBM risk-free; it shows why the division's name is too broad to settle the durability question.
Four lines, with one moving backward
The annual-report grouping, footnote 2, also includes management and other fees, plus private banking and lending. The following reconstruction keeps those categories intact. FICC means fixed income, currencies and commodities. All values are net revenue, in USD millions.
| Component | Q2 2025 | Q2 2026 | Change |
|---|---|---|---|
FICC financing | 1,064 | 1,216 | +152 |
Equities financing | 1,706 | 3,259 | +1,553 |
Management and other fees | 2,802 | 3,355 | +553 |
Private banking and lending | 789 | 689 | −100 |
Four-line sum | 6,361 | 8,519 | +2,158 |
Reported inputs: 10-Q, pages 112 and 117, cross-checked against the July results, page 6. Sum and changes are Hynexly calculations. This is a cross-segment grouping, not a separate reported division.
Equities financing supplied 72.0% of the sum's increase. The other components mattered, but they did not grow in unison. Keeping the negative row visible is more informative than describing the entire basket as uniformly stronger.
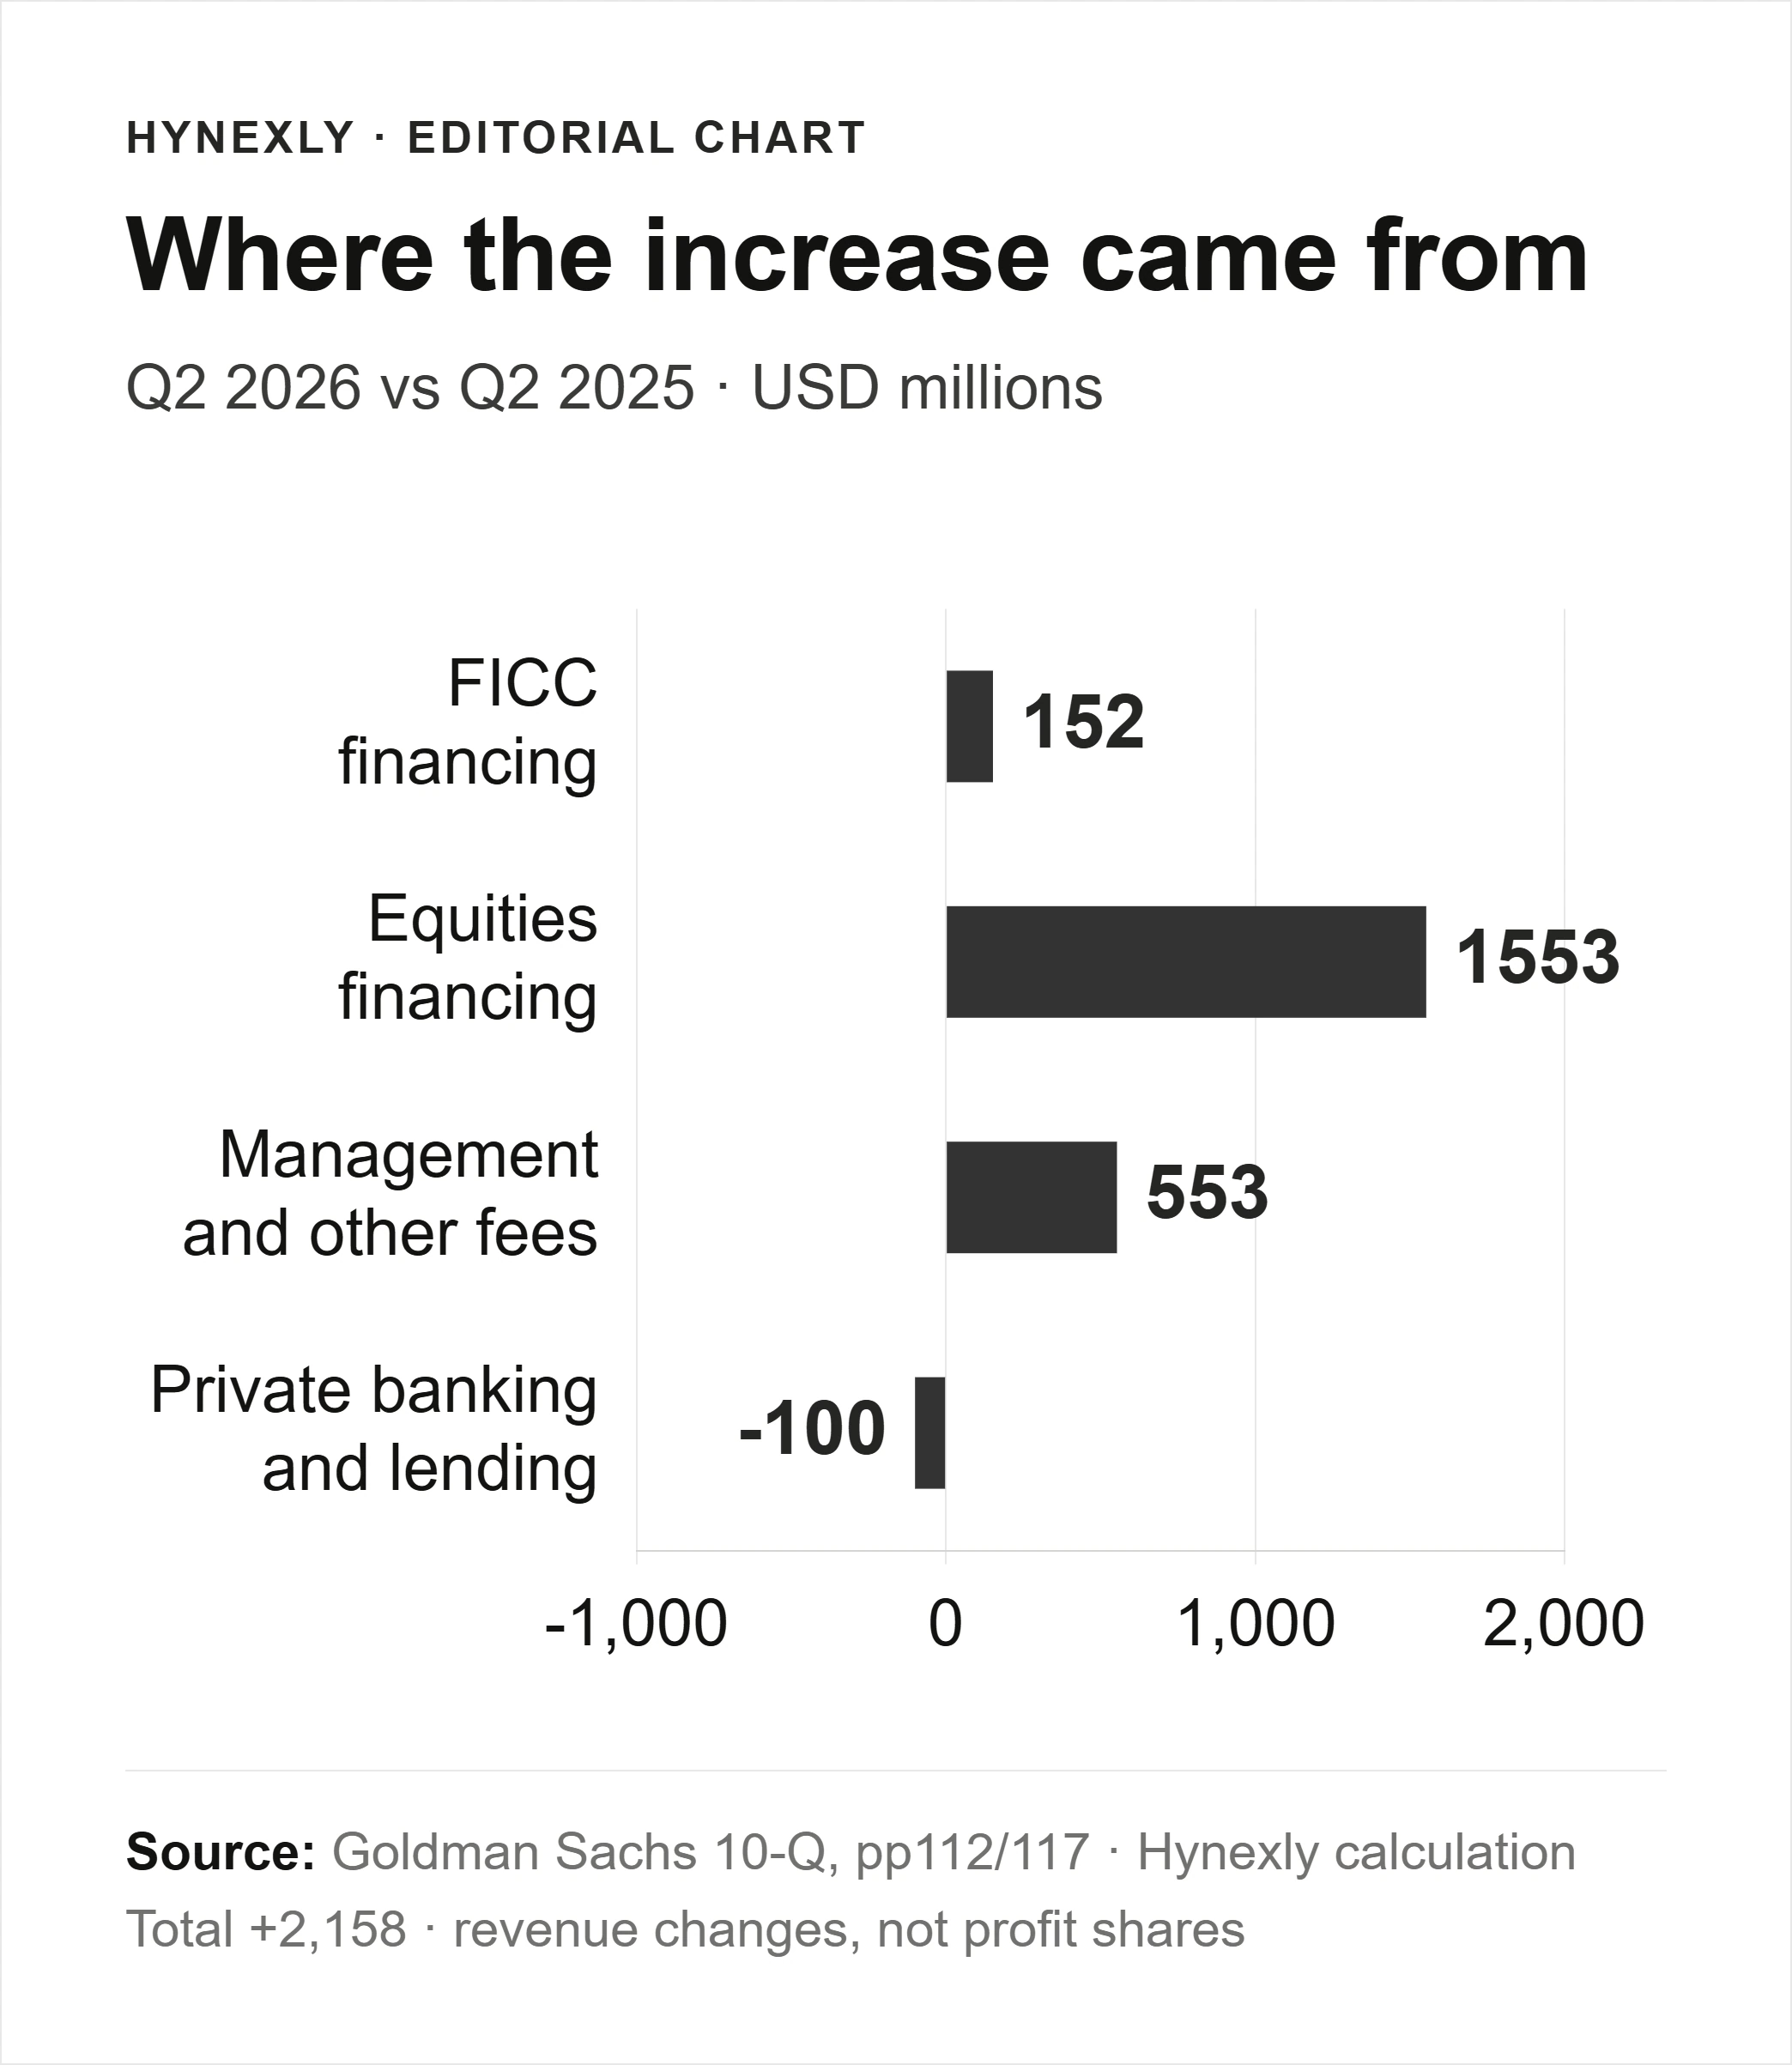
Source-derived chart: 10-Q, pages 112 and 117. Q2 year-over-year changes, USD millions; Hynexly calculation. These are contributions to revenue growth, not profit shares or forecasts.
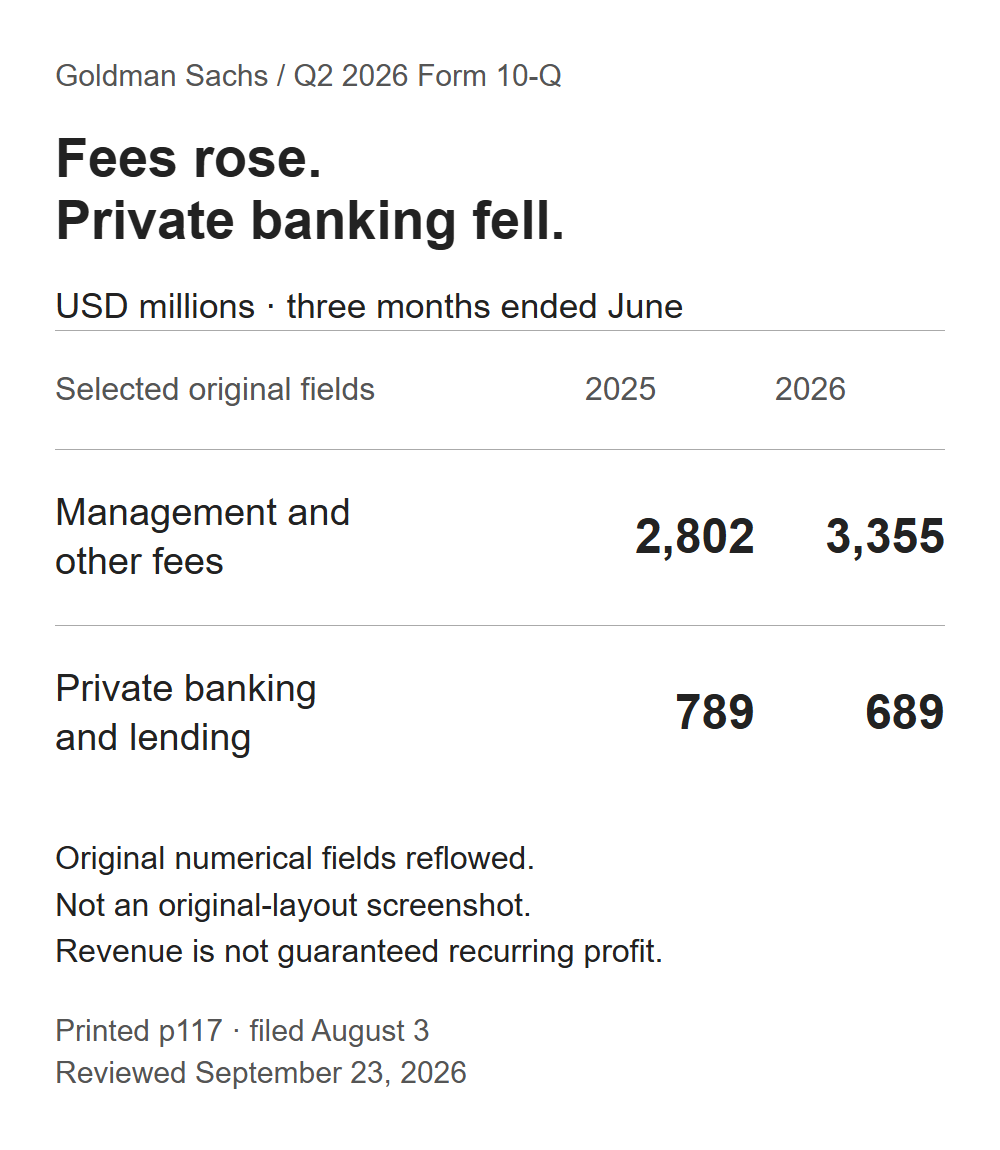
Source evidence: 10-Q, printed page 117, filed 2026-08-03, reviewed 2026-09-23. Selected original numerical fields reflowed; not an original-layout screenshot. Three months ended June; USD millions.
Goldman attributes the private-banking decline to a lower net interest margin on Marcus deposits, partly offset by higher average deposit balances. It attributes the fee increase mainly to higher average assets under supervision. Neither explanation supports calling all these revenues independent of market conditions. Incentive fees and investment gains are outside this four-line calculation; the excluded remainder should not simply be renamed “trading.”
A higher percentage can also mislead
The sum rose from $6.361B to $8.519B. Total net revenue rose from $14.583B to $20.338B. Divide each sum by its matching total and the share falls from 43.6% to 41.9%. The denominator grew faster. That alone says nothing about whether the component dollars weakened.
The reverse can happen, too. This deliberately simple example is hypothetical, not Goldman data or an earnings forecast:
| Hypothetical revenue | Starting period | Later period |
|---|---|---|
Selected revenues | $8B | $7B |
Total revenues | $20B | $14B |
Selected share | 40% | 50% |
A rule that rewards a rising share would approve this example even though both revenue amounts fell. That is why this analysis uses no minimum mix percentage as an automatic pass. Watch component dollars and the costs and risks required to earn them.
There is also no verified current share-price or consensus benchmark in this article. The comparison is operational: annualized Q2 return on average common equity was 23.5%, against Goldman's disclosed 14–16% through-the-cycle target. That target covers a cycle, not every quarter. Neither number establishes what the stock currently prices in or whether it is cheap.
Strong conversion, with a cost to maintain
There is a solid favorable case. Net revenue grew 39.5%, faster than operating expenses at 26.3%. Dividing expense by revenue gives a Q2 efficiency ratio of 57.4%, down from 63.4%. Lower means less operating expense per dollar of revenue. This was genuine operating improvement, not merely a presentation change.
The risk is that financing and fees weaken at the same time as client activity, while expenses adjust more slowly. Financing can use balance-sheet capacity and create credit exposure; fees can fall with asset values or withdrawals. The label “more durable” does not remove those connections. Nor does a revenue bridge tell us the incremental capital or profit attributable to each line.
What would change the judgment
Goldman's calendar schedules Q3 results for 2026-10-13, subject to change. The useful follow-up is a like-for-like comparison, not another arbitrary threshold.
| Next check | Evidence that strengthens the case | Evidence that weakens it |
|---|---|---|
Financing and fees | Component dollars remain resilient as activity changes | Financing and management fees decline together |
Expense conversion | Revenue gains continue to exceed added operating costs | Costs absorb the revenue improvement |
Credit and capital | Revenue growth remains compatible with manageable losses and capital needs | Extra exposure consumes the apparent earnings benefit |
One lower mix percentage would not change the judgment. Weaker component revenues, worse expense conversion and mounting risk together would. Conversely, sustained component earnings capacity under less favorable activity would be stronger evidence than Q2's high return alone.
The bank-earnings guide explains how to keep denominators consistent. The Citi credit-cost analysis applies a similar component check to a different accounting line. JPMorgan's return analysis addresses the separate issue of reported versus adjusted returns.
Sources and limits
Source review: 2026-09-23. Calculations use the August filing's comparative quarters, checked against July's release; printed PDF page numbers are used above. The four-line sum follows the annual-report classification but is calculated here. Its growth contribution is not recurring profit, and financing within GBM must not be counted again as a separate division.
The 2026-09-16 conference page was checked, but the linked audio remarks were not independently verified for this revision. No new conference guidance is asserted. AI assisted drafting, calculations and visual production; Hynexly retains editorial responsibility. General information only, not personalized investment advice, a rating or a price target.
Frequently Asked Questions
Annualized return on average common equity was 23.5%. The August 3 filing gives a 14–16% through-the-cycle company target, which is not a promise for each quarter.
The four-line sum grew 33.9%, but total net revenue grew faster. Its share fell 1.7 percentage points. These are Hynexly calculations using the company's annual-report grouping.
No. FICC financing and Equities financing sit inside that division. The division's growth contribution cannot be treated as entirely short-lived trading revenue.
Primary references cited or linked in this analysis. Click through to read each source in full.
- Goldman Sachs Q2 2026 Form 10-Q, filed August 3
- Goldman Sachs Q2 2026 results, July 14
- Goldman Sachs 2025 annual report: revenue grouping, footnote 2
- Goldman Sachs 2026 earnings calendar
- goldmansachs.com/investor-relations/presentations/2026/gs-presentation-at-barclays-24th-annual-global-financial-services-conference
Choose the next evidence gap to investigate.
Bank of America: How Much Growth Survives Quieter Markets?
BAC's Q2 growth was broad, but Global Markets also supplied nearly half the NII increase. Separate overlapping revenue measures, costs and credit before extrapolating.
Owner-operated US market research desk
Owner-operated US stock and market coverage built from public filings, SEC EDGAR, official reports, company releases, and market data.
- Source-grounded research with primary filings & official reports
- Bilingual EN / KO editorial workflow
- Manual editorial QA before publish