JPMorgan Q2: Adjusted Does Not Mean Normal
JPMorgan’s adjusted return removes investment gains, not the market cycle. Rebuild the Q2 revenue mix and test what the remaining earnings can sustain.
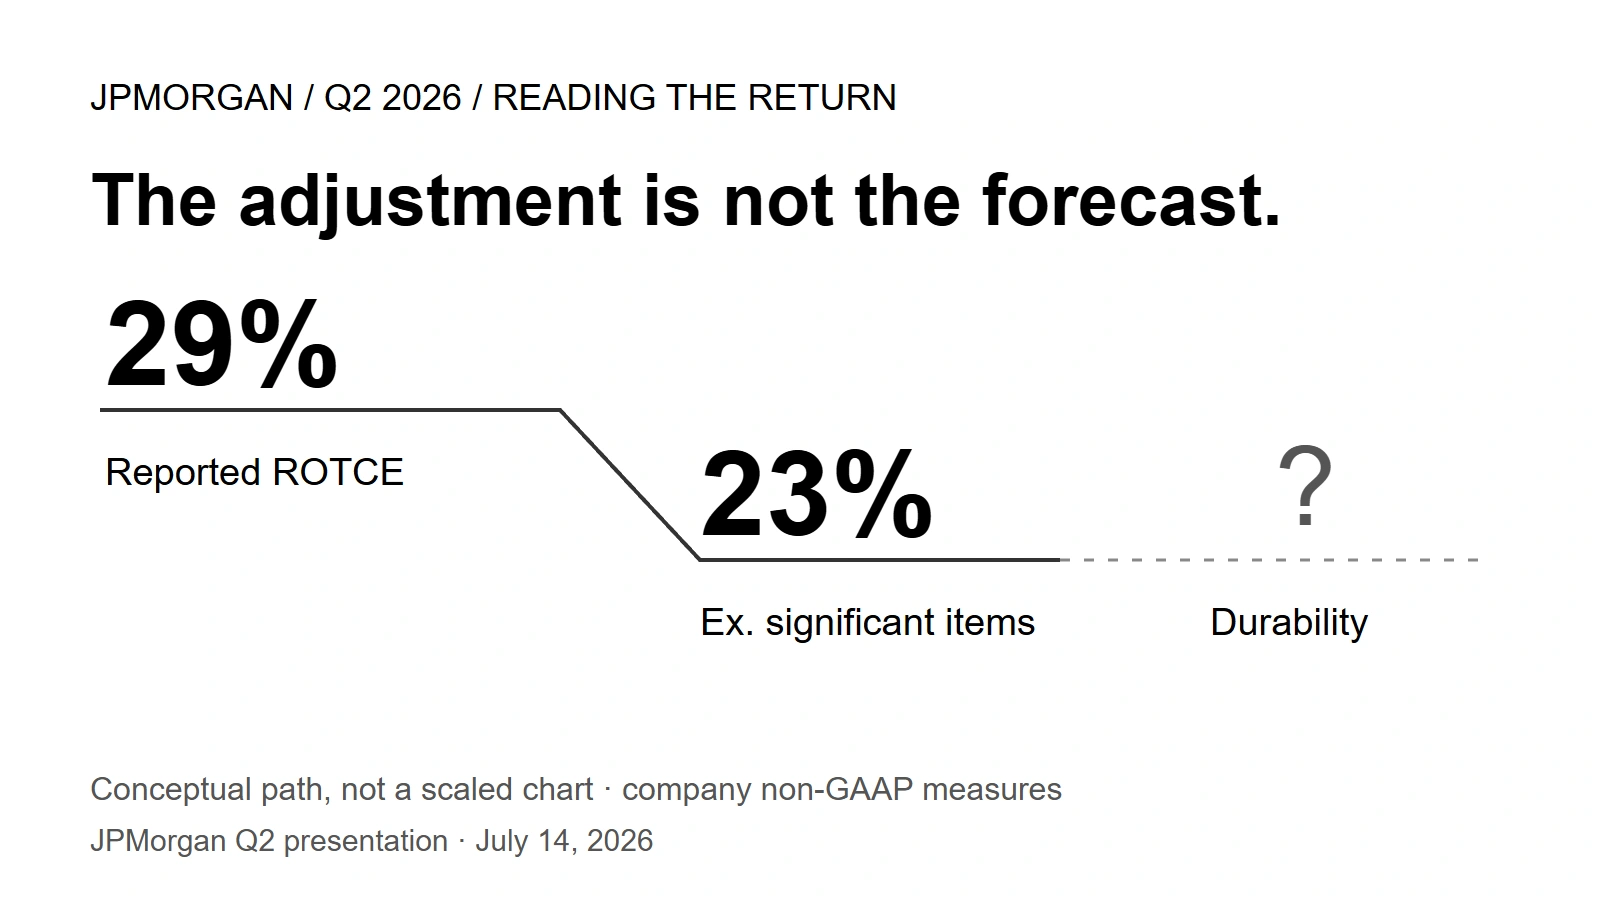
“Adjusted” can sound like “normal.” For JPMorgan's second quarter, that is a step too far. The bank's return on tangible common equity fell from 29% to 23% after removing disclosed investment gains. The adjustment makes the quarter easier to compare. It does not establish what the bank can earn when customer trading activity cools.
That distinction matters before carrying a strong quarter into an earnings forecast. The remaining businesses include both everyday banking and activities that benefit from rising asset prices. They need separate tests, even when all their revenue survives the accounting adjustment.
| Question | What the adjustment answers | What it leaves open |
|---|---|---|
What did the investment gains add? | Remove their disclosed contribution | Whether similar gains recur |
How durable is the remaining profit? | Nothing by itself | Trading activity, fees, funding costs and credit losses |
Return on tangible common equity, or ROTCE, relates profit available to common shareholders to their average equity after specified intangible assets are removed. It is an annualized, non-GAAP measure of capital use—not a shareholder's stock return. A smaller denominator can affect it, so reading the percentage without the earnings and capital behind it is incomplete.
Start with what actually came out
The earnings presentation gives both the pretax gains and their after-tax contribution. Keeping those columns separate prevents a basic error: subtracting pretax gains from net income.
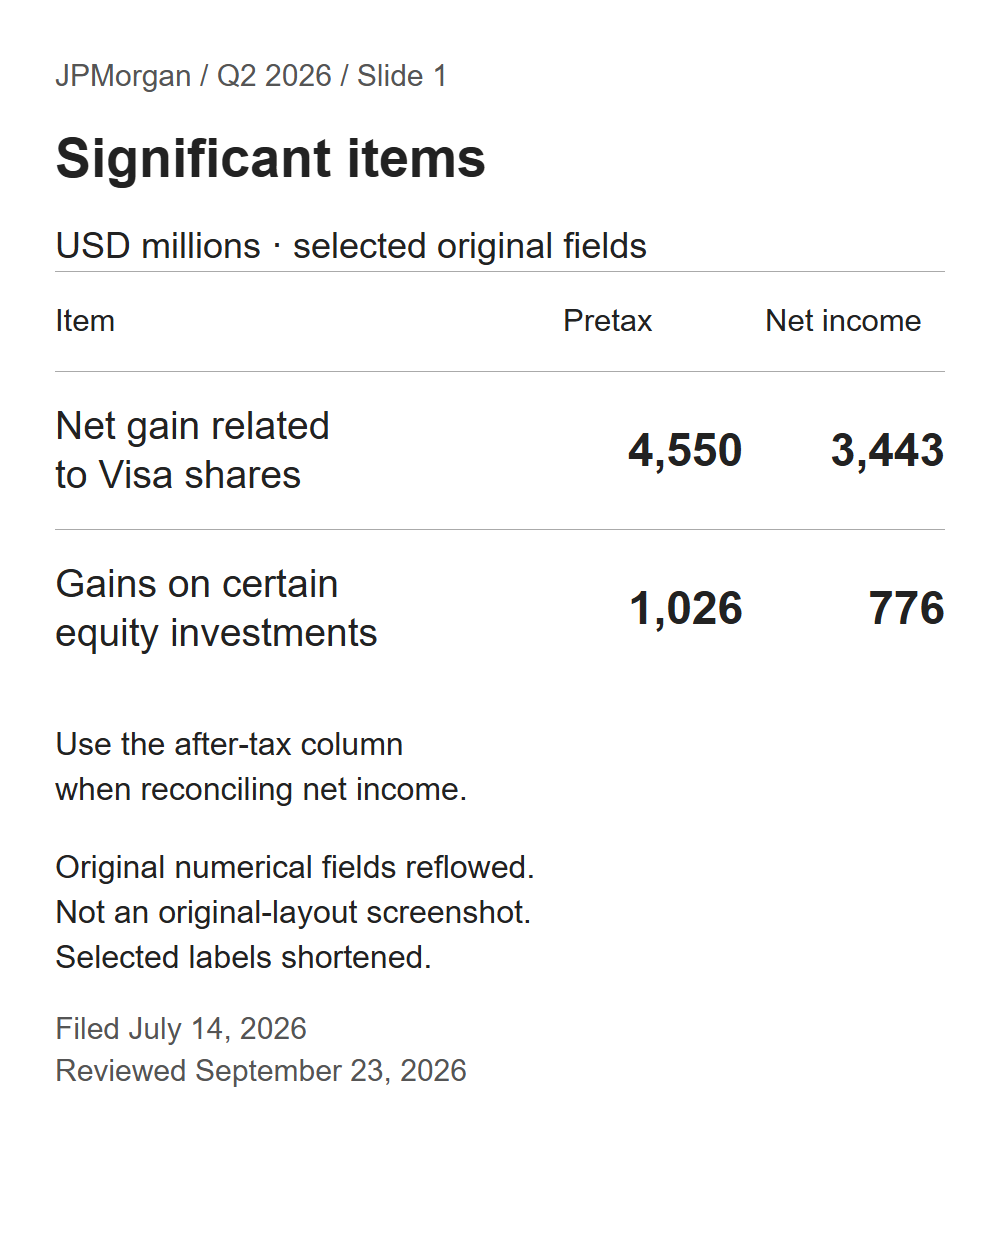
Visa-related gains added $3.443B after tax; gains on certain equity investments added $0.776B. Subtract both from reported net income of $21.155B and the remainder is $16.936B. The bank rounds that to $16.9B. Its corresponding diluted earnings per share fall from $7.70 to $6.14.
This is a useful correction, but it is deliberately narrow. It removes identified gains rather than estimating a through-cycle average. The adjusted result still includes the quarter's actual lending, payments, asset-management and trading performance. Calling every remaining dollar repeatable would make an assumption the reconciliation never tested.
Follow the growth that remains
Revenue requires the pretax column. Subtract $5.576B of gains from managed revenue of $58.022B: the adjusted subtotal is $52.446B. Against $45.680B a year earlier, that leaves $6.766B of growth, or 14.8%.
Managed revenue is itself non-GAAP: JPMorgan puts certain tax-favored income on a taxable-equivalent basis. The matching tax adjustment leaves net income unchanged. This is not cash revenue, and the subtotal above is our calculation—not an extra reported business segment.
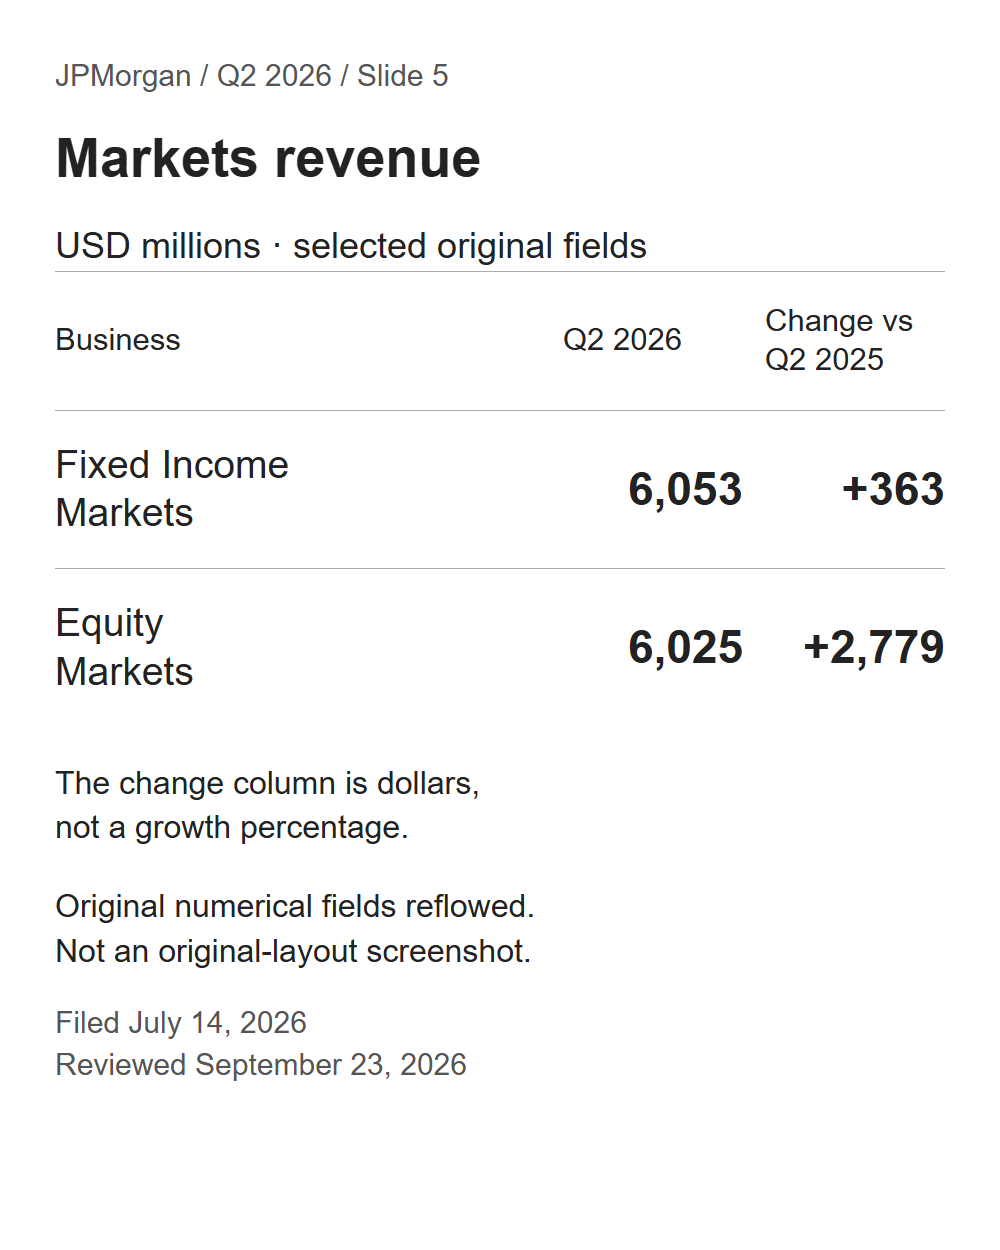
Markets added $3.142B: $0.363B from Fixed Income and $2.779B from Equities. Divide that increase by the adjusted firmwide increase and Markets accounts for 46.4%. Other sources account for $3.624B, or 53.6%.
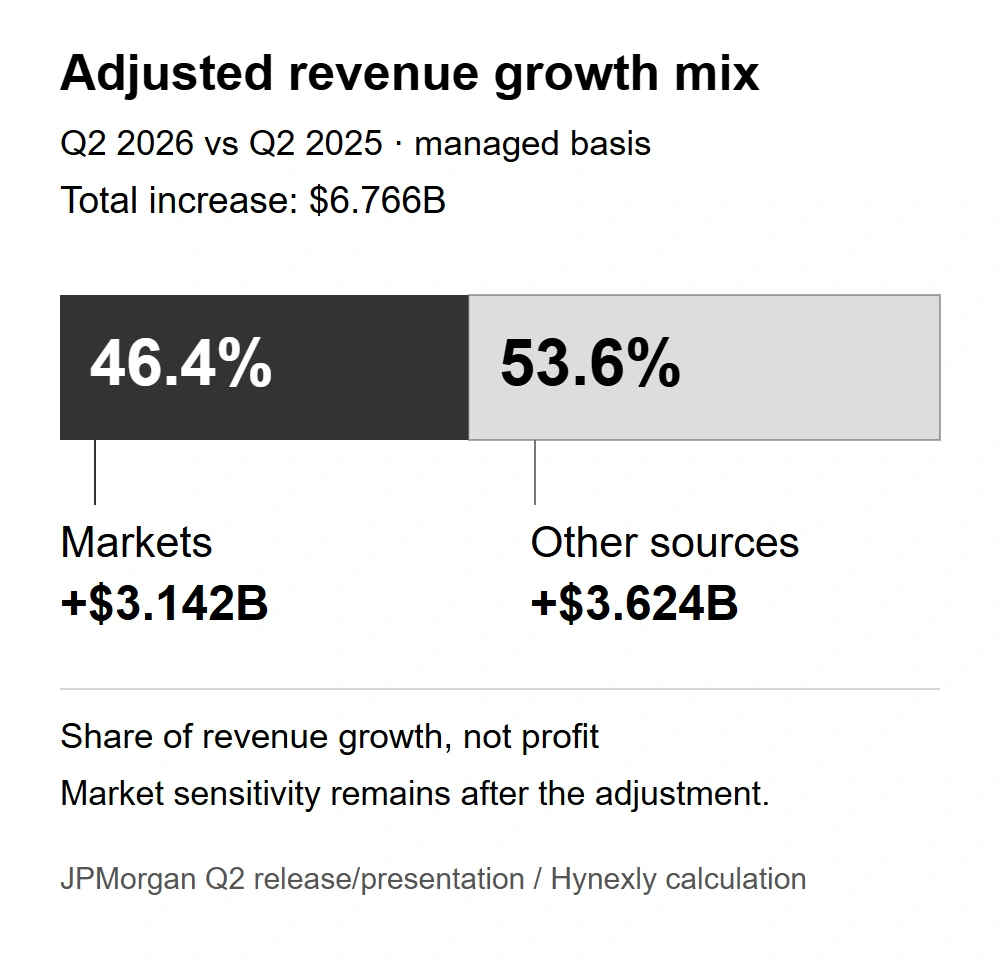
Nearly half the remaining growth came from Markets. That is not evidence of weak revenue: client trading and financing are real businesses. It does mean the accounting adjustment leaves a substantial exposure to activity levels. Revenue could slow without another special gain disappearing, and the earnings effect would depend on how quickly related costs respond.
Outside Markets is not outside the market cycle
The strongest counterargument is that growth was broader than trading. Net interest income excluding Markets grew 4%; noninterest revenue excluding Markets and the significant items grew 19%. The bank did not need a single revenue source to improve.
Yet that second bucket includes asset-management fees. The release attributes part of their strength to higher market levels and inflows. A fee business can produce income every quarter while its amount changes with asset prices and client balances. “Recurring” describes the activity, not a guaranteed earnings level.
| Remaining activity | What can support it | What can interrupt it |
|---|---|---|
Lending and deposits | More balances and favorable pricing | Lower lending yields, deposit competition or credit losses |
Asset-management fees | Inflows and higher managed asset values | Outflows or lower market values |
Client trading and financing | Customer activity and demand for financing | Quieter activity or less favorable trading conditions |
These are sensitivities, not a forecast that every business will weaken together. Diversification may help precisely because the drivers differ. But labeling the entire non-Markets remainder “stable” would discard the distinctions that make diversification worth examining.
What a valuation argument still needs
This review does not include a dated share price or verified analyst consensus. It therefore cannot establish whether the market already prices in resilient returns, or whether JPMorgan is cheap. An operating result is evidence for a valuation model, not the model's conclusion.
The narrower question is whether earnings hold up with less help from favorable activity. An investor extrapolating the adjusted quarter needs assumptions about fee growth, interest margins, expenses and required capital. If those assumptions are missing, replacing reported earnings with adjusted earnings has only made the starting point cleaner.
Watch costs and credit together
Expenses can respond to revenue, but not necessarily on the same timetable. Compensation tied to revenue may ease with activity; technology, buildings and some staffing commitments may take longer. That timing difference can turn a moderate revenue slowdown into a larger profit slowdown. It is a risk to test, not a cost forecast.
Credit and capital need their own comparisons. These matched figures describe different constraints; they are not a combined score.
| Measure | Prior-year reference | Q2 reference |
|---|---|---|
Card Services net charge-off rate | 3.40% | 3.34% |
Tangible book value per share | $103.40 | $113.35 |
Standardized CET1 ratio | 15.1% | 14.1% |
Source-derived explanation: presentation, slides 3–4. Credit rates compare second quarters; capital measures compare June-end balances. The measures have different denominators.
The card rate measures realized net credit losses relative to the loan base; it should not be equated with provisions, which also reflect reserve changes. The bank earnings guide shows why those lines can move differently.
Capital also matters to the return ratio. Tangible book value per share rose, while standardized CET1 fell. CET1 is a regulatory capital-to-risk-weighted-assets ratio. These movements can coexist; a growing per-share capital base does not establish that regulatory capacity is unchanged.
The October check is about conditions, not a magic threshold
The September 17 notice schedules results for October 13, 2026 at approximately 7:00 a.m. ET and the call at 8:30 a.m. ET. Dates and times remain subject to change.
| Next check | Dated reference | What would change the reading |
|---|---|---|
Revenue and costs | July 14 outlook: full-year NII excluding Markets about $96.5B; adjusted expense about $107.5B | Weaker activity with costs failing to adjust would reduce confidence |
Consumer credit | July 14 outlook: full-year Card Services net charge-off rate about 3.2% | A worsening loss path alongside higher provisions would add pressure |
Return and capital | Rebuild the new quarter's significant-item adjustment and capital ratios | Resilient adjusted earnings with less trading help would strengthen durability |
The second-quarter filing repeats these July outlooks; they are market-dependent expectations, not guaranteed outcomes or a newly issued September forecast. Adjusted expense excludes firmwide legal expense. A quarterly credit rate and a full-year outlook also cover different periods.
One quieter trading quarter would not settle the case. More convincing evidence would be a combination: less Markets support, resilient income elsewhere, responsive costs and contained credit losses. The opposite combination would weaken confidence. The useful mental model is simple: removing gains cleans up a comparison; repeated performance under different conditions establishes durability.
Sources and calculation notes
The after-tax reconciliation uses the disclosed gain contributions. The revenue calculation uses their pretax amounts and matches second-quarter periods. Markets growth combines the disclosed Fixed Income and Equities changes; the other-source contribution is the residual. Rounding happens after calculation. None of these calculations converts revenue contribution into profit contribution.
Hynexly reviewed the release, presentation, filing outlook and call notice on September 23, 2026. The original article date is retained. AI assisted research organization, graphics and language review; editorial responsibility remains with the owner-operated desk. No sponsorship or affiliate relationship with JPMorgan is disclosed. This is general information, not personalized investment advice or an investment rating.
Frequently Asked Questions
No. Removing specified gains still leaves the quarter’s lending, fee and client-trading performance. Durability needs evidence under different market conditions.
It is Markets’ contribution to the year-over-year increase in adjusted managed revenue, not its share of total revenue or net income.
Primary references cited or linked in this analysis. Click through to read each source in full.
Choose the next evidence gap to investigate.
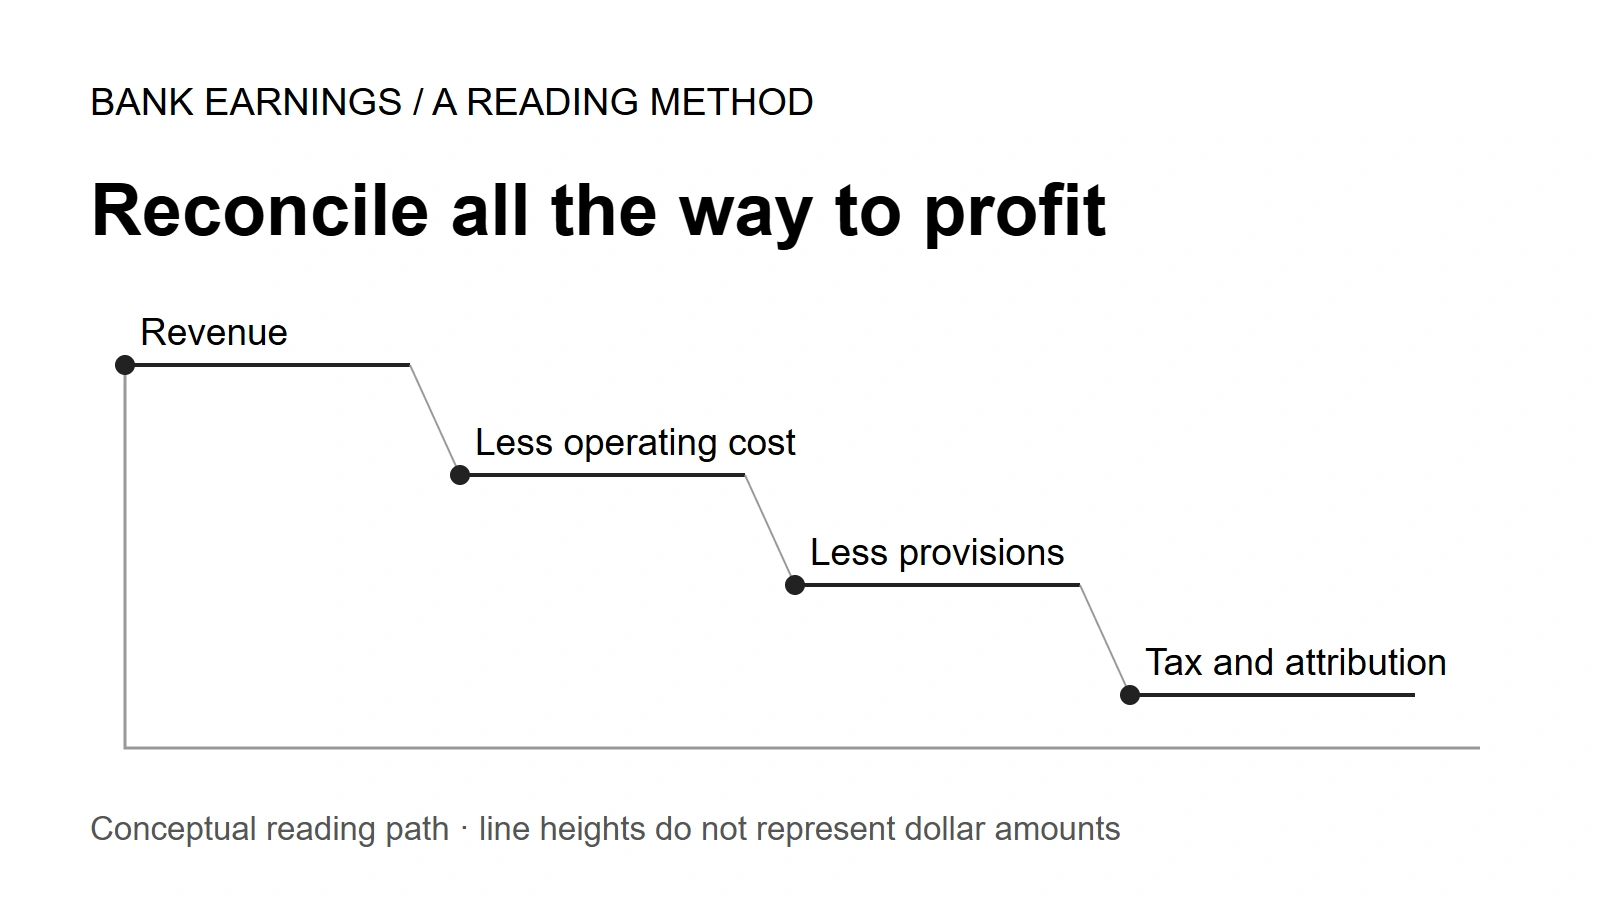
Bank Earnings: When Two Correct Calculations Disagree
Read bank earnings from revenue to net income. A BAC–Citi worked example separates growth rates, profit dollars, provisions and the attribution line.
Owner-operated US market research desk
Owner-operated US stock and market coverage built from public filings, SEC EDGAR, official reports, company releases, and market data.
- Source-grounded research with primary filings & official reports
- Bilingual EN / KO editorial workflow
- Manual editorial QA before publish