Market & Macro
What Microsoft's FY26 Q2 Filings Say About Azure Demand and the AI Capex Ramp
Azure demand and commercial RPO against cash-funded AI capex: how Microsoft's 2026 cloud margin and Intelligent Cloud profit actually balance out.
(Sources: Microsoft FY26 Q2 Press Release & Webcast, Microsoft FY26 Q2 Investor Metrics, Microsoft FY26 Q2 Segment Results, Microsoft FY26 Q2 Cash Flows, Microsoft FY26 Q2 Performance)
Which is the real story of Microsoft's FY26 Q2 — record Azure demand, or a runaway capex bill? The headline framing demanded a choice; the filings themselves refused to make one. That sent this desk through the cash-flow statement and the metrics page line by line, where the $49.3 billion of property and equipment additions only made sense once it sat beside the $625 billion of commercial remaining performance obligation cited below. Neither number carries the story alone. We kept both on the same page throughout.
Related reading: What the 2026 FOMC Calendar Says About When Fed Cuts Can Come | The KRBN Wrapper Is the First Check Before Carbon Credit Exposure | Verify Your Broker Before You Pick a Single U.S. Stock
Thesis
The 2026 Microsoft read does not resolve into a one-line Azure-growth call. The useful test is whether Azure growth, cloud backlog, and operating income are still strong enough to justify how fast Microsoft's infrastructure spending is ramping.
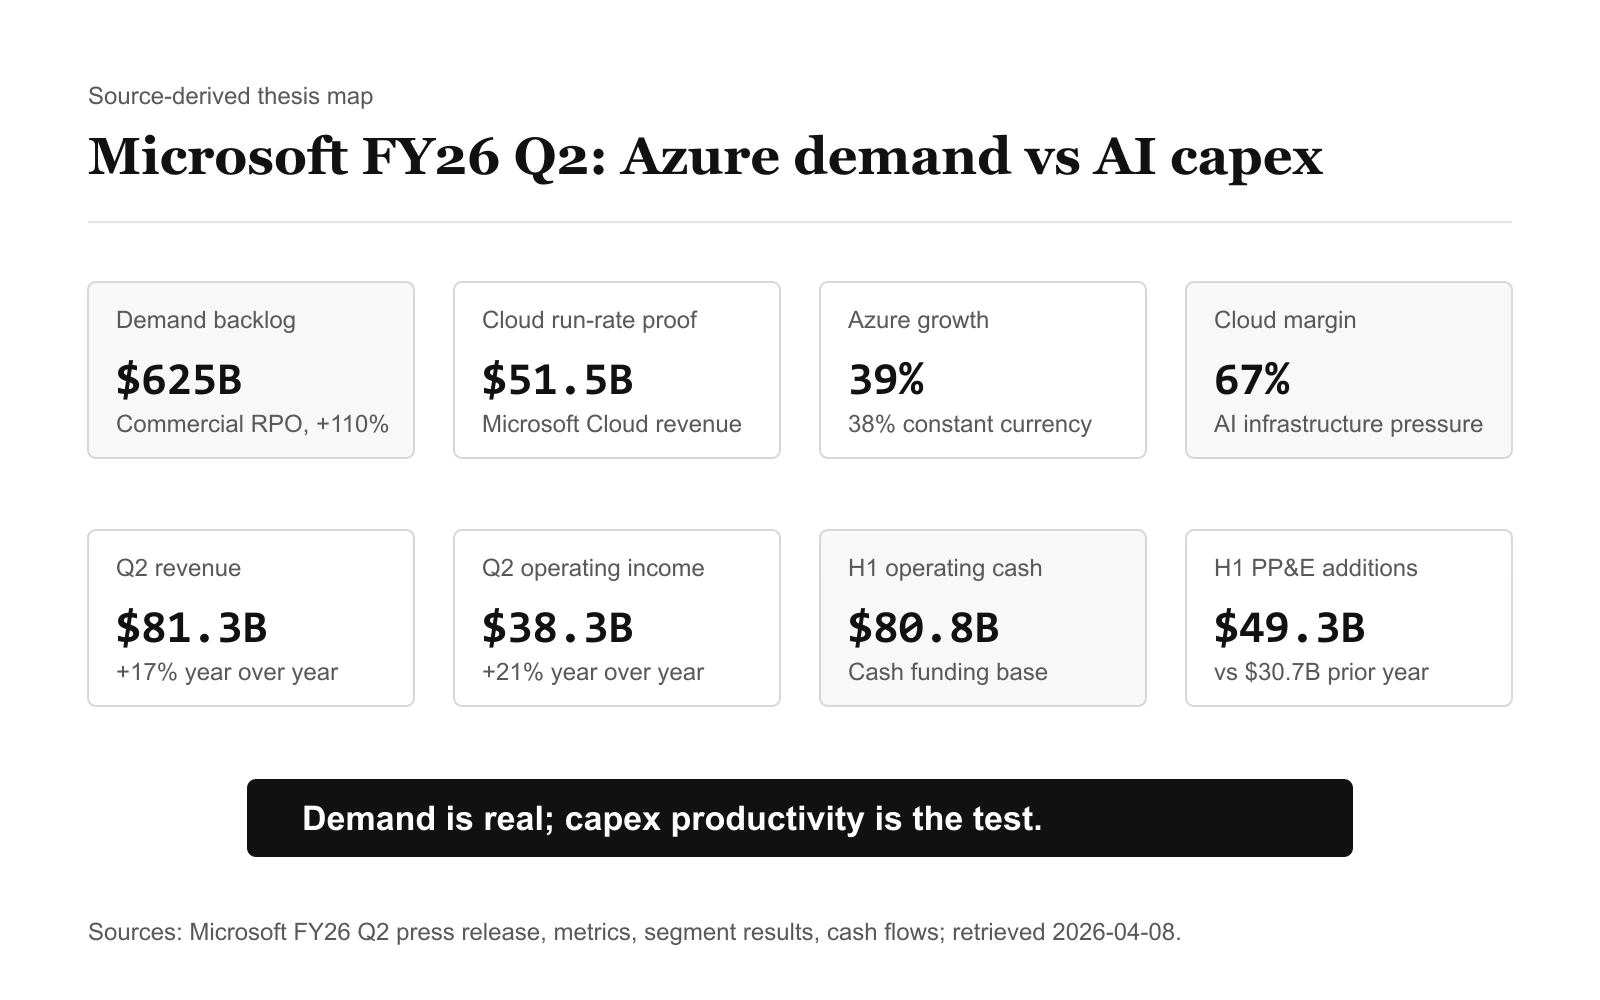
The latest official filings make that trade-off much easier to see. On January 28, 2026, Microsoft said revenue reached $81.3 billion in fiscal Q2, operating income was $38.3 billion, and Microsoft Cloud revenue rose to $51.5 billion. The same release also said commercial remaining performance obligation jumped 110% to $625 billion. That is the demand side.
The cost side is in the cash-flow statement. Over the first six months of fiscal 2026, additions to property and equipment rose to $49.3 billion from $30.7 billion a year earlier. That is roughly 60% growth in the line item that best shows how hard Microsoft is leaning into datacenter buildout.
So the equity debate is not whether Microsoft has demand. It clearly does. The debate is whether that demand stays large enough, profitable enough, and durable enough to keep the AI infrastructure bill from becoming the main variable.
Source Evidence Snapshot
The hero map now carries the whole underwriting sequence: backlog demand, Azure growth, cloud margin, operating profit, operating cash flow, and the property-and-equipment buildout. The body evidence keeps two non-overlapping visual roles: demand/backlog quality and cash-funded infrastructure intensity. Intelligent Cloud segment profit remains a source note so the article does not stack three Microsoft table captures in a row.
 Source-derived demand map: figures from the Microsoft FY26 Q2 Investor Metrics and press release, captured 2026-04-08: Azure and other cloud services growth 39% (38% cc), Microsoft Cloud gross margin 67%, Microsoft Cloud revenue $51.5B, and commercial RPO $625B. The 12.1x RPO-to-quarterly-cloud-revenue line is article-derived math from those figures. Figures are source-derived; layout is editorial rendering.
Investor Metrics |
Press release.
Source-derived demand map: figures from the Microsoft FY26 Q2 Investor Metrics and press release, captured 2026-04-08: Azure and other cloud services growth 39% (38% cc), Microsoft Cloud gross margin 67%, Microsoft Cloud revenue $51.5B, and commercial RPO $625B. The 12.1x RPO-to-quarterly-cloud-revenue line is article-derived math from those figures. Figures are source-derived; layout is editorial rendering.
Investor Metrics |
Press release.
The investor metrics table is the fastest way to see the quarter's core tension. It shows commercial remaining performance obligation at $625 billion, Microsoft Cloud revenue at $51.5 billion, Microsoft Cloud gross margin at 67%, and Azure and other cloud services revenue growth at 39% year over year. Demand is clearly large. Margins are still high. But the margin line is no longer moving up.
Source note: Microsoft FY26 Q2 Segment Results, captured 2026-04-08. Intelligent Cloud revenue was $32.9 billion in the quarter and $63.8 billion over the first half, while segment operating income was $13.9 billion and $27.3 billion, respectively.
 Source-derived cash-flow map: figures from the Microsoft FY26 Q2 cash-flow statement, captured 2026-04-08 (six months ended Dec. 31, 2025): operating cash flow $80.815B, property and equipment additions $49.270B versus $30.727B a year earlier, share repurchases $13.065B, and dividends paid $12.931B. Rounded values are shown in the image. Figures are source-derived; layout is editorial rendering.
Cash flows.
Source-derived cash-flow map: figures from the Microsoft FY26 Q2 cash-flow statement, captured 2026-04-08 (six months ended Dec. 31, 2025): operating cash flow $80.815B, property and equipment additions $49.270B versus $30.727B a year earlier, share repurchases $13.065B, and dividends paid $12.931B. Rounded values are shown in the image. Figures are source-derived; layout is editorial rendering.
Cash flows.
This is the line investors cannot skip. Microsoft reported first-half operating cash flow of $80.8 billion, common-stock repurchases of $13.1 billion, cash dividends of $12.9 billion, and additions to property and equipment of $49.3 billion. That means the company is still producing huge internal cash, but it is also reinvesting at a rate that would have looked extreme for Microsoft only a few years ago.
What the Street is Pricing
The market is effectively pricing Microsoft as an AI infrastructure winner with enough Azure demand to absorb a heavier datacenter buildout. That is a reasonable starting point, but it is also a higher bar than a normal cloud-growth case.
Azure and other cloud services revenue grew 39% in the quarter, and Microsoft Cloud revenue reached 51.5 billion dollars. That is not the profile of a business running out of commercial demand.
The backlog line makes the same point from a different angle. Commercial remaining performance obligation rose to $625 billion. That number matters because it represents contracted but unrecognized revenue still sitting ahead of the income statement. It does not all convert at once, but it tells you demand is not being scraped together quarter by quarter.
Put the two figures the filings already give us on the same line. The $625 billion of commercial backlog is roughly 12 times the $51.5 billion of Microsoft Cloud revenue the company booked in the quarter (625 ÷ 51.5 ≈ 12.1). In other words, contracted-but-unrecognized commitments alone equal about twelve quarters — three years — of the current cloud run-rate. That is the concrete reason the market is willing to underwrite a heavier datacenter bill: it is not pricing a single strong quarter, it is pricing a multi-year book of signed demand sitting in front of revenue. The qualifier is that RPO converts on its own schedule, not on the buildout's, so the coverage is a measure of contracted demand, not a guarantee of when capacity gets paid back.
Microsoft's own performance page reinforces the message. It says revenue increased by $11.6 billion, driven mainly by Intelligent Cloud and Productivity and Business Processes, and that Microsoft Cloud gross margin percentage slipped to 67% because of continued investments in AI infrastructure and growing AI product usage. That last clause matters. Margin pressure is not showing up because demand vanished. It is showing up because demand is expensive to serve.
That is a healthier problem than weak bookings: the margin is being spent down to serve demand, not eroded by its absence. The watch item is narrower than the bull-bear framing suggests — not whether demand exists, but whether the twelve-quarter backlog converts fast enough to keep the capex line productive.
Risks to the Thesis
The main risk is not that Microsoft lacks demand. It is that the infrastructure curve becomes too heavy if Azure growth or cloud margin normalizes before the new capacity produces enough revenue.
Some AI writeups get trapped at the top line. Microsoft's filings are more useful because the segment table still shows strong operating income inside Intelligent Cloud.
Quarterly Intelligent Cloud revenue reached $32.9 billion, up from $25.5 billion a year earlier. Operating income for the segment reached $13.9 billion, up from $10.9 billion. Over the first six months, the segment produced $27.3 billion of operating income on $63.8 billion of revenue.
That is why the Microsoft case is stronger than a generic "AI infrastructure is expensive" claim. The cloud business is not just growing fast enough to absorb the capex conversation. It is still growing profit dollars as well.
But the gap between growth and spending is now narrow enough to matter. If Azure growth slows materially before the current investment cycle matures, investors will notice quickly because the fixed-cost base is rising so aggressively.
AI Capex Is No Longer a Background Detail
The cash-flow statement is where the quarter really becomes a stock-analysis piece instead of a product narrative.
Microsoft generated $80.8 billion of operating cash flow in the first six months of fiscal 2026. That is enormous. But the same statement shows additions to property and equipment of $49.3 billion, up from $30.7 billion in the comparable prior-year period. That is about a 60% increase.
That comparison is why the capex debate now belongs near the center of the stock read. Azure grew 39%, while property and equipment additions grew even faster.
That does not automatically make the spending reckless. Microsoft can afford it. The same filing also shows the company still returned capital through $13.1 billion of share repurchases and $12.9 billion of dividends during the first half. The business remains very cash generative.
Still, the quarter makes one thing clear: Microsoft is funding AI infrastructure at a scale where future returns have to stay visible. Investors are no longer being asked to underwrite only near-term product momentum. They are underwriting a multi-year datacenter and model-capacity buildout.
What Flips the Call
The cleanest way to read the stock now is to track three relationships instead of one.
First, watch whether Azure growth stays strong enough to justify the pace of infrastructure additions. A cloud business can support heavy capex when growth is still this high. The risk shows up if growth normalizes faster than spend does.
Second, watch commercial remaining performance obligation and Microsoft Cloud gross margin together. The backlog line tells you whether demand is still forming in front of revenue. The margin line tells you how expensive that demand is to fulfill.
Third, keep segment profit in the picture. Intelligent Cloud operating income is what stops the story from collapsing into "great demand, terrible economics." Right now, those economics are still solid. The point is not that Microsoft's spending is out of control. The point is that the stock increasingly depends on continued proof that the spending is productive.
That is why this quarter is useful. It does not support a lazy bear case, because demand and profits are both real. It also does not support a lazy bull case, because the infrastructure bill is no longer small enough to ignore.
The most defensible conclusion is that Microsoft still looks like a high-quality compounder with real AI demand behind it. But the equity case will depend less on whether AI is exciting and more on whether Azure growth, backlog conversion, and cloud profitability stay comfortably ahead of the capex curve.