Tesla delivered more cars. Why was cash after investment still negative?
Tesla beat dated delivery and cash-flow expectations, yet Q2 investment outran operating cash. A source-backed comparison separates the surprise from the funding gap.
More cars left Tesla for customers, but the company still spent more on capital investment than its operations generated. The delivery headline and the cash deficit describe the same quarter. Neither cancels the other.
The useful question is how far the stronger sales carried the business. Revenue cleared its dated analyst benchmark; operating profit did not. Cash generation also exceeded expectations, yet investment grew faster than operating cash compared with the previous quarter.
That leaves a narrower conclusion than either an unqualified success or a failed investment cycle. Tesla demonstrated demand and collected cash. It has not yet shown that this pace of expansion can consistently pay for itself from operations.
The profit left after selling the cars
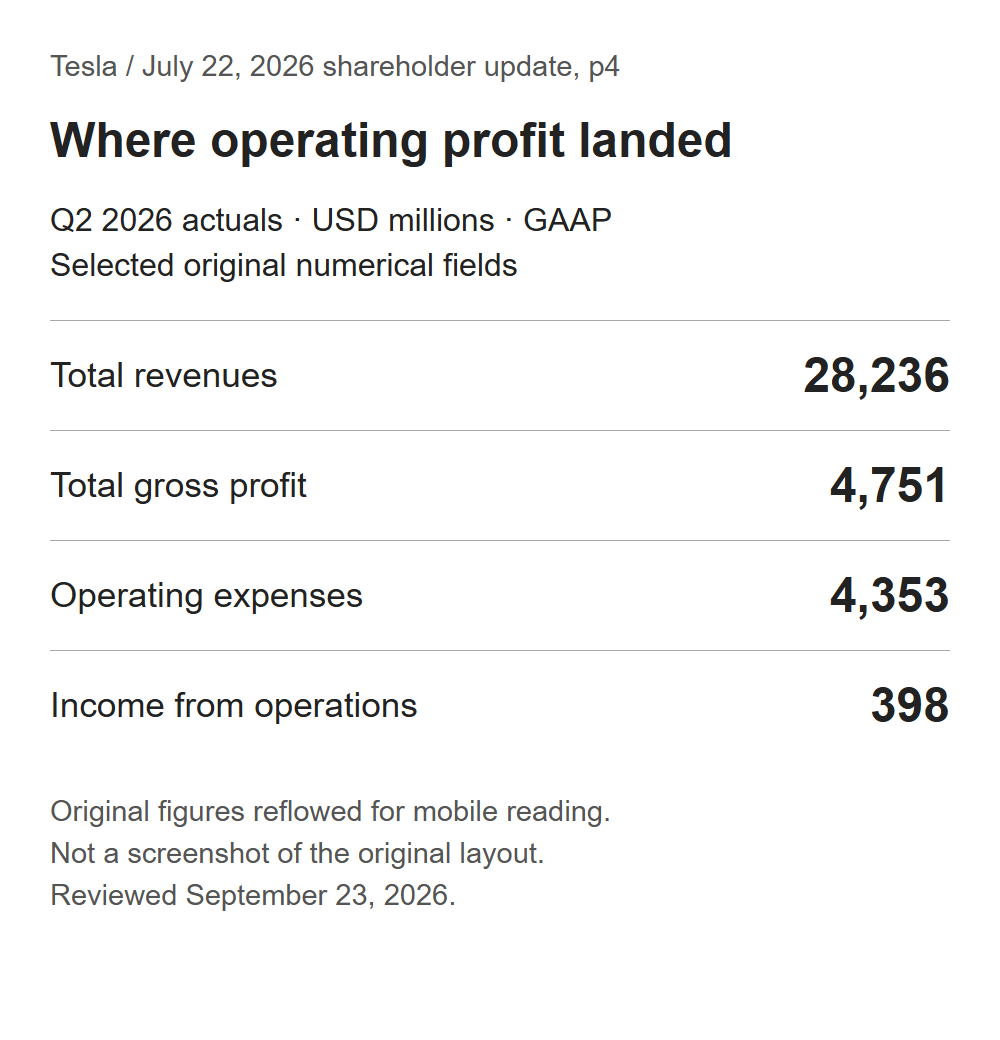
The large revenue total is not the amount Tesla can spend freely. After costs of sales, gross profit was $4.751B. Subtract $4.353B of operating expenses and operating income was $398M. That is an income-statement calculation, not a calculation of cash in the bank.
It also covers the whole company. Vehicle sales sit alongside energy and services; dividing total revenue by deliveries would not reveal the price paid for an average new car. Product mix, leases and revenue recognized at different times complicate that shortcut.
Which expectations did Tesla beat?
The delivery surprise was real: 480,126 vehicles versus a mean of 406,024, or 18.3% more. But that mean came from the June 26 delivery survey. The financial survey followed on July 17, after the vehicle count was already public. These are successive checkpoints, not one unchanged forecast.
| Measure | Dated analyst average | Q2 actual |
|---|---|---|
Deliveries, vehicles; June 26 survey | 406,024 | 480,126 |
Revenue, USD millions; July 17 survey | 27,584 | 28,236 |
Gross profit, USD millions; July 17 survey | 5,378 | 4,751 |
Operating income, USD millions; July 17 survey | 1,503 | 398 |
Source-derived comparison: delivery survey, earnings survey, delivery result and shareholder update. Financial fields are GAAP. Surveys are company-compiled analyst estimates, not Tesla guidance or endorsement.
Revenue exceeded its average by $652M while operating income missed by $1.105B. The two results should not be compressed into a single “beat.” Higher sales and weaker profit conversion can coexist.
Nor do these historical averages tell us what the share price implies today. They establish the operating hurdle before the report. A current valuation judgment would require a dated market price and a separate set of forward assumptions; this article does not manufacture either.
The price explanation needs its qualifier
The shareholder update identifies lower vehicle average selling prices excluding foreign exchange, including mix, as a headwind. It also names lower regulatory credits, higher operating expenses and energy warranty charges. Those are management's explanations of year-over-year performance, not a quantified explanation of every dollar missed against consensus.
The filing uses different wording about unit prices. Keeping the measurement basis visible matters:
| Official document | What its price discussion says | What not to infer |
|---|---|---|
Shareholder update, page 25 | Lower vehicle ASP excluding FX, including mix | Every reported dollar selling price fell |
Form 10-Q, page 31 | Higher unit ASP driven primarily by mix, plus a favorable currency effect | An exact disclosed vehicle ASP in dollars |
Both sources together | Price language depends on basis and scope | A complete numerical reconciliation between the descriptions |
Source-derived reading guide: shareholder update and Form 10-Q. The reviewed passages do not provide a complete numerical reconciliation.
That is a reason to avoid a confident shortcut, not to ignore pricing. The disclosed profit outcome is clear even where its price decomposition is not. A rising car count does not settle the amount earned on those cars.
Cash generation improved; investment rose faster
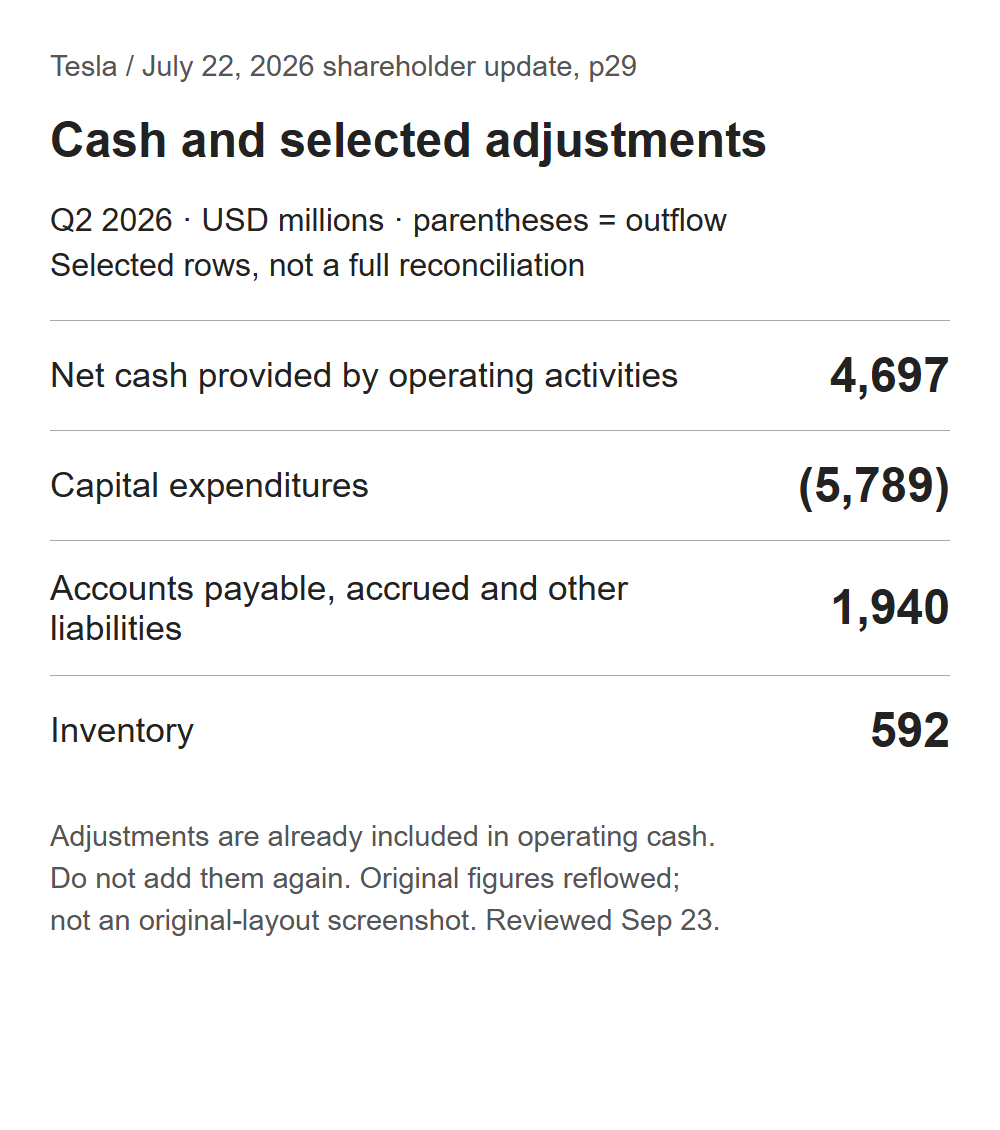
Operating cash flow of $4.697B less capital spending of $5.789B leaves -$1.092B. Tesla calls this non-GAAP free cash flow. It is a useful investment-funding measure, not automatically distributable shareholder cash: it does not incorporate every investing or financing payment.
The cash total also contains timing effects. Accounts payable, accrued and other liabilities added $1.940B, while inventory movements contributed $592M. Those categories are broader than unpaid supplier invoices alone. The figures do not establish how much of that support will recur.
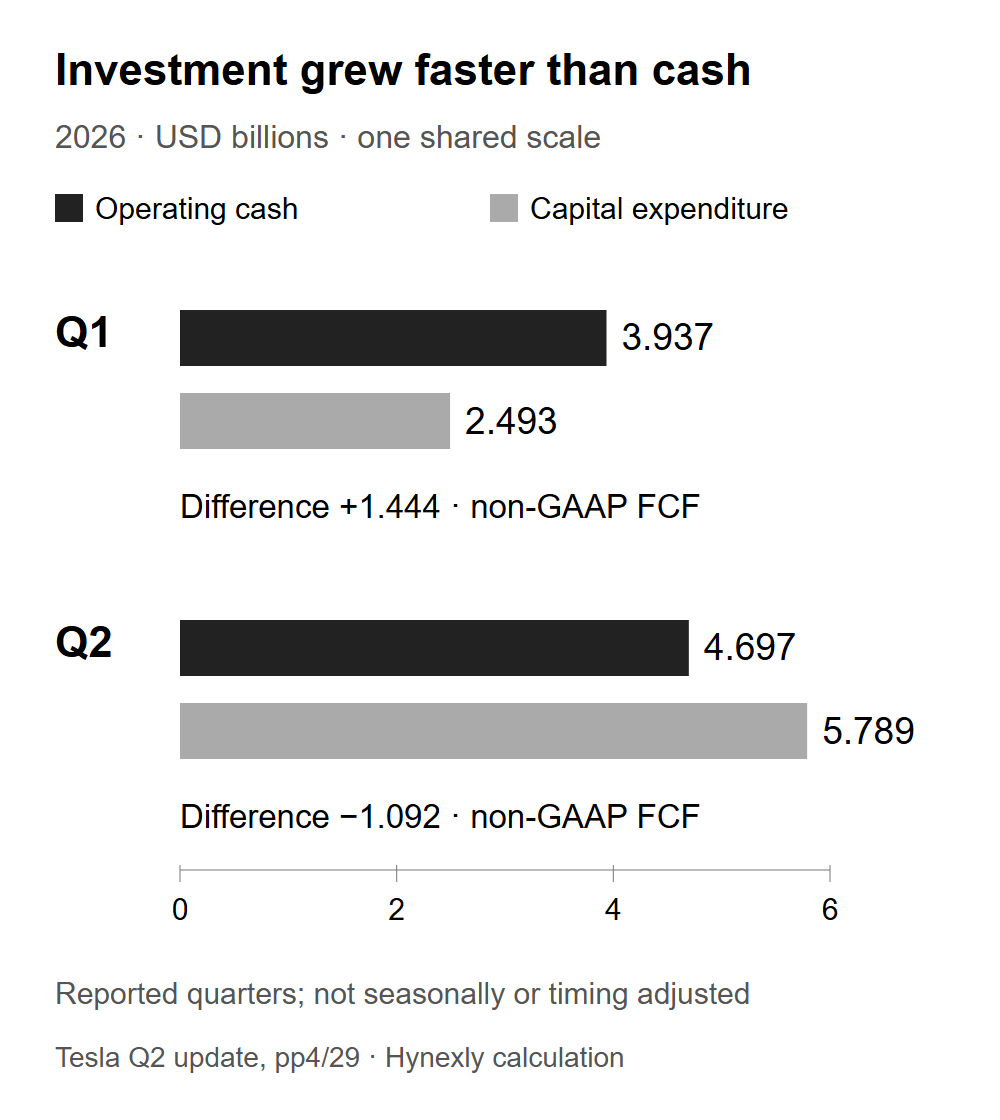
Against the previous quarter, operating cash rose $760M but capex increased $3.296B. The difference pushed free cash flow down $2.536B. A stronger operating business can therefore report worse cash after investment when its expansion accelerates.
A smaller deficit is still a deficit
Against the July 17 analyst average, cash after investment looked much better. Here is the calculation in USD millions:
| Comparison with the dated average | Favorable difference |
|---|---|
Operating cash: 4,697 minus 3,445 | +1,252 |
Capex spending: 6,698 minus 5,789 | +909 |
Sum of those components | +2,161 |
Published FCF: -1,092 minus -3,254 | +2,162 |
Unreconciled difference in published inputs | 1 |
Source-derived calculation: Tesla's earnings survey and shareholder update. The published rounded averages leave a $1M residual. Rounding or aggregation may contribute; the source does not establish the cause.
The residual is too small to change the interpretation, but large enough that an exact-looking chart should not hide it. The main finding survives: the deficit was much smaller than analysts had expected. That is an expectations result, not evidence that investment was fully funded by operations.
The strongest case for the spending
A cash deficit during expansion does not by itself mean poor capital allocation. New factories, computing infrastructure and products may produce revenue and cash later. Tesla's filing projects annual capital spending above $25B, with several programs still being built or ramped. It also acknowledges that heavy investment periods may need funding beyond operating cash. Form 10-Q, capital-expenditure outlook.
The favorable case is that present spending creates productive assets and better future economics. The risk is not simply the size of the bill. It is committing capital without enough evidence about utilization, paying customers and the return earned on that capital.
There is a nearer-term risk too: cash supported by liability and inventory movements can reverse before new projects contribute. Profit pressure and the timing of investment therefore deserve separate checks.
What would change this reading?
| Next disclosed evidence | More constructive | Less constructive |
|---|---|---|
Operating cash and working capital | Cash grows without increasing dependence on timing support | Cash weakens as temporary support reverses |
Margin and operating expenses | More revenue produces proportionately more profit | Revenue grows but costs absorb the benefit |
Investment milestones | Assets enter use with measurable customer economics | Spending rises while economic outputs remain unclear |
Q3 ends on September 30. The Tesla investor calendar checked on September 23 did not display a Q3 earnings date, so no reporting date is assumed here.
The decision rule is straightforward: do not ask the delivery count to answer the cash question. Look for repeated evidence that operating cash can cover investment while profit conversion improves. One positive quarter would help; it would not establish the eventual return on every new project.
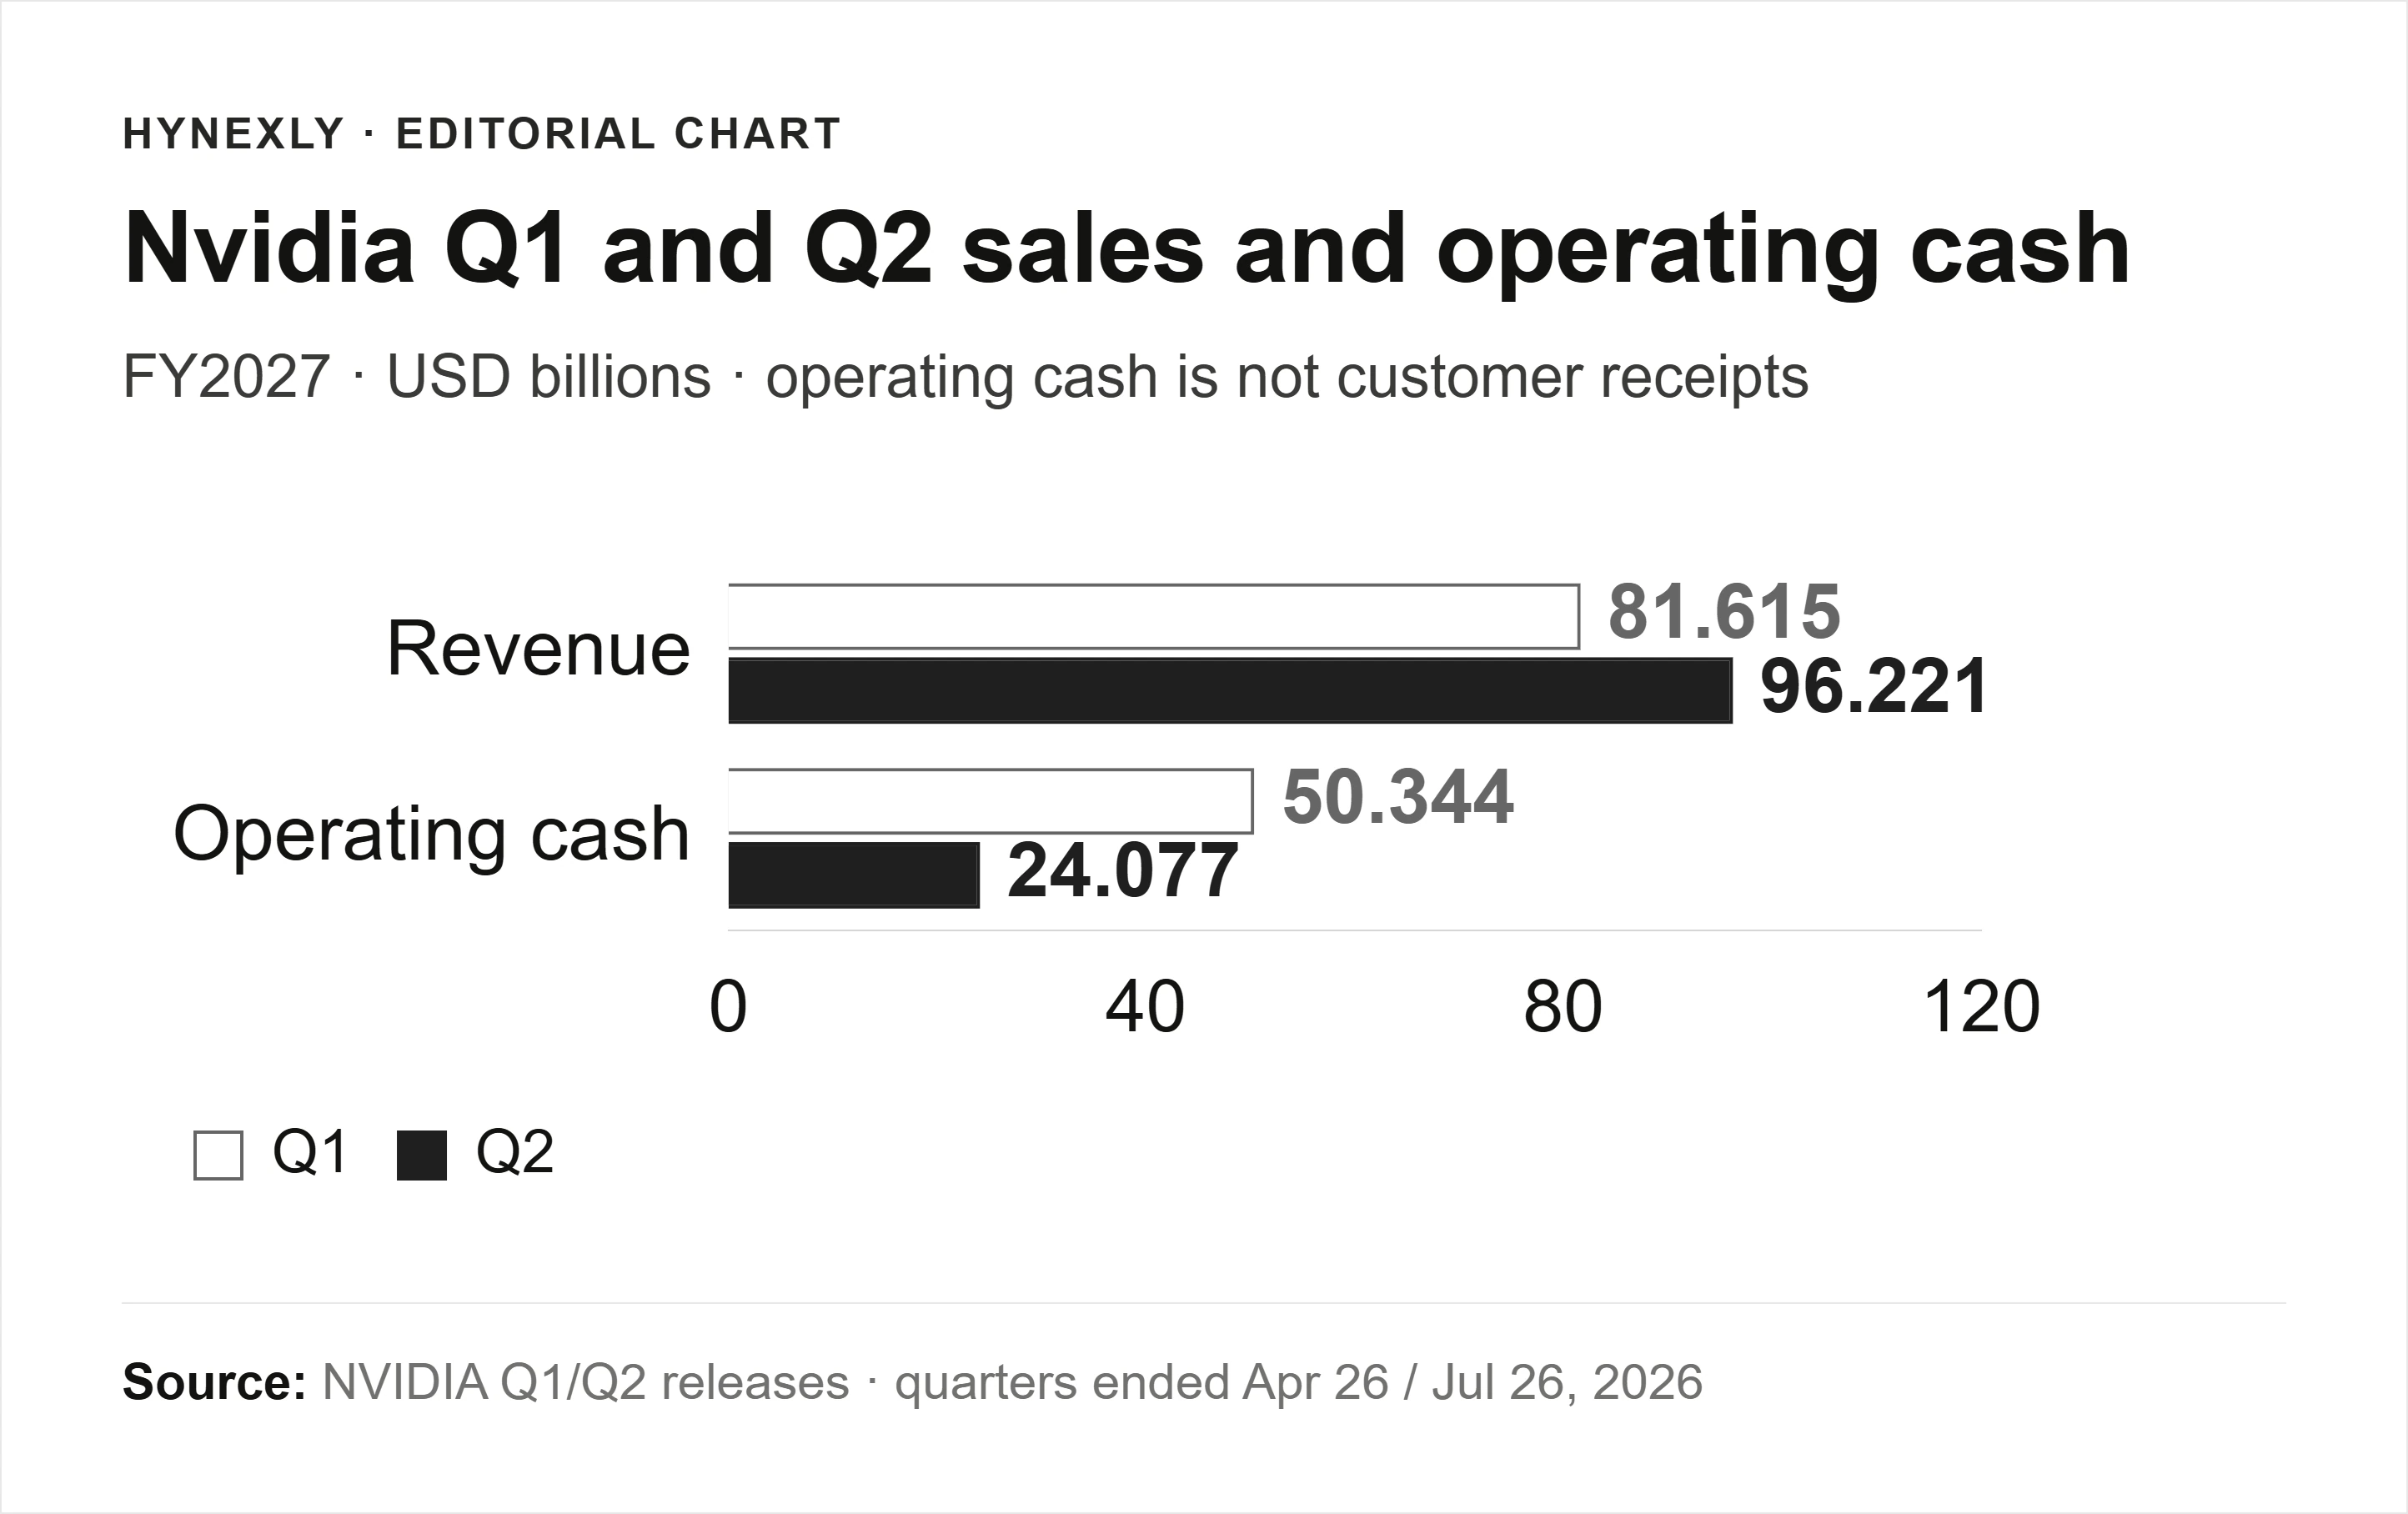
For a comparable cash-versus-growth problem, the Nvidia cash-conversion baseline separates company cash from product-level economics. The Micron contract analysis asks a related question: how much future demand a commitment really protects.
Sources, calculations and limits
Review date: 2026-09-23. Actuals refer to the quarter ended 2026-06-30; the sequential comparison uses the preceding quarter. Analyst averages retain their original survey dates. Monetary shorthand B means billion and M means million US dollars.
Calculations use disclosed rounded inputs, with the residual shown rather than forced to zero. No precise vehicle ASP, recurring-cash estimate, current valuation or investment recommendation is inferred. AI assisted with source organization, arithmetic, graphics and bilingual review; Hynexly is responsible for the editorial presentation. This is general educational analysis, not personalized financial advice.
Frequently Asked Questions
Tesla reported $4.697B of operating cash and $5.789B of capex, leaving -$1.092B of non-GAAP free cash flow. That measure is not the cash automatically available for distribution to shareholders.
Deliveries count vehicles, while profit also reflects price, product mix, credits, costs and operating expenses. Tesla's two analyst surveys also have different dates and contributor sets.
Primary references cited or linked in this analysis. Click through to read each source in full.
Choose the next evidence gap to investigate.
Nvidia's Sales Grew. Why Did Operating Cash Flow Halve?
Nvidia's Q2 sales rose while operating cash fell. A $20.1B increase in receivables-related cash use explains much of the gap, without proving customer default.
Owner-operated US market research desk
Owner-operated US stock and market coverage built from public filings, SEC EDGAR, official reports, company releases, and market data.
- Source-grounded research with primary filings & official reports
- Bilingual EN / KO editorial workflow
- Manual editorial QA before publish