Green Transition
BYD and Tesla EV Numbers Change Once the Denominator Is Fixed
BYD's NEV scale and Tesla's BEV-only base aren't the same denominator. A filing-first 2026 read on EV mix quality and margin discipline before the headline numbers.
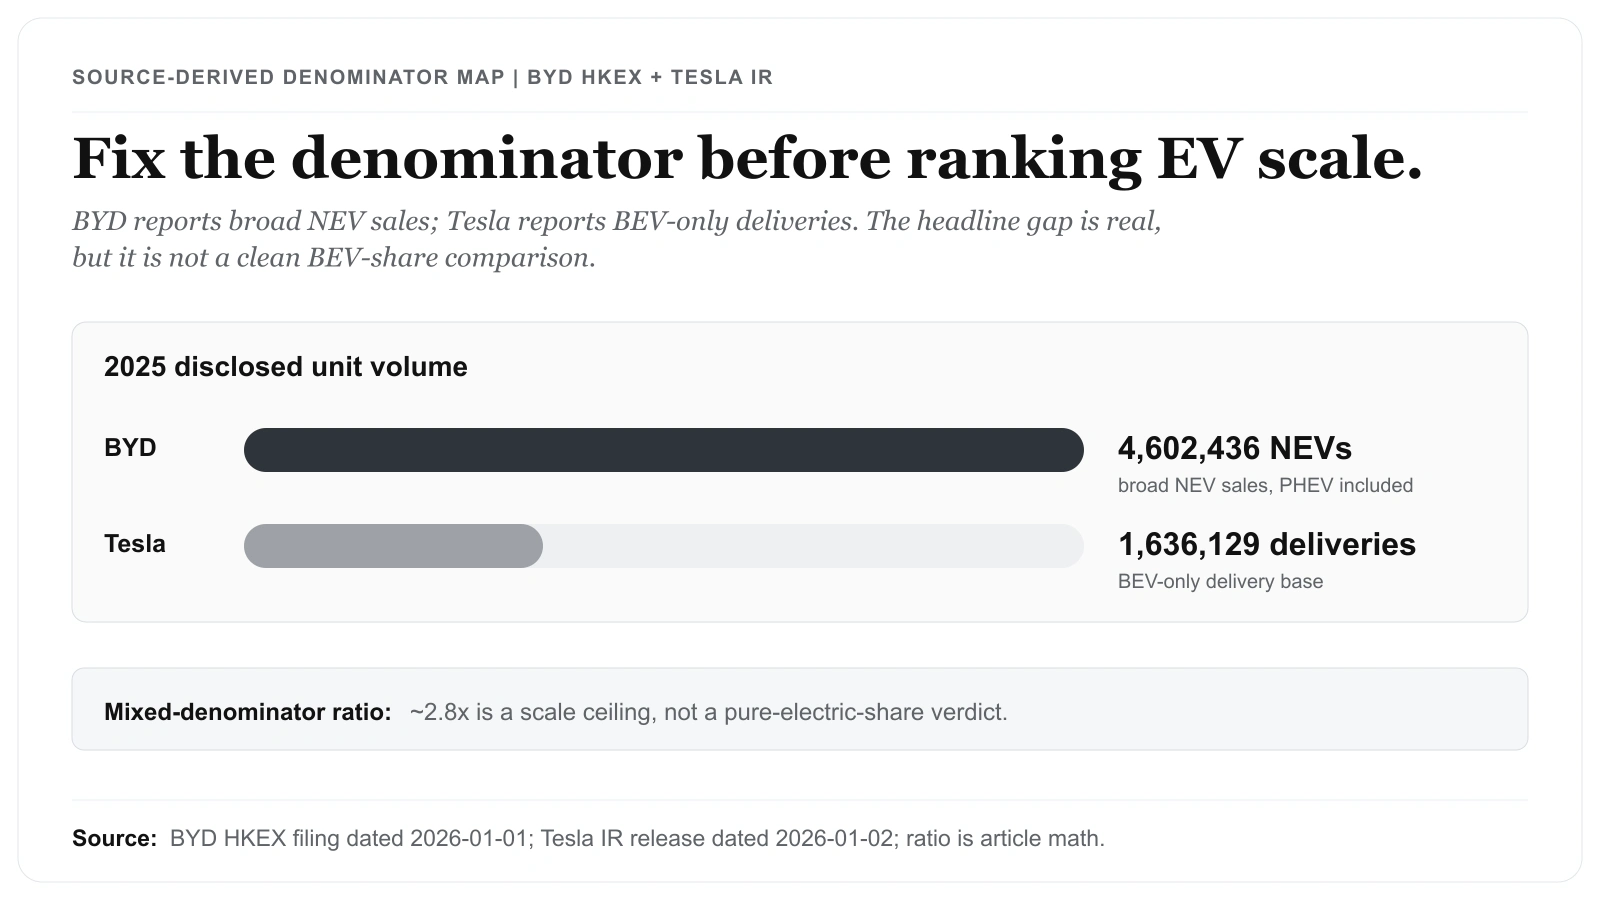
A single-leader EV headline was the first casualty of this comparison: the two disclosures do not share a denominator, so we set the ranking aside until the definitions were settled. BYD's 4,602,436 comes straight from its January 1, 2026 HKEX filing and is a broad NEV total. Tesla's 1,636,129, from the January 2, 2026 investor-relations release, counts BEV-only deliveries. Only with both definitions pinned down did the scale comparison stand.
Thesis
A 2026 read on Tesla and BYD is not a simple single-leader EV story. The stronger reading is that BYD now has the broader disclosed unit scale, while Tesla still needs to be judged on BEV-only economics, production-to-delivery conversion, and margin durability.
Related reading: The KRBN Wrapper Is the First Check Before Carbon Credit Exposure | What the 2026 FOMC Calendar Says About When Fed Cuts Can Come | Verify Your Broker Before You Pick a Single U.S. Stock
BYD disclosed 4,602,436 year-to-date 2025 new energy vehicle sales in its January 1, 2026 HKEX filing, while Tesla reported 1,636,129 total 2025 vehicle deliveries in its January 2, 2026 investor-relations release. On raw unit count, BYD is now operating at a meaningfully larger scale.
(Source: BYD Company Limited - Voluntary Announcement, Production and Sales Volume for December 2025 (HKEX PDF)) (Additional source: Tesla Investor Relations - Tesla Fourth Quarter 2025 Production, Deliveries & Deployments)
That still does not settle the equity comparison. BYD's disclosed figure is a broad NEV total, including plug-in hybrids, while Tesla's figure is a BEV-only delivery number. The 2026 read therefore depends less on a headline rank and more on whether the metric definitions stay consistent.
Source Evidence Snapshot
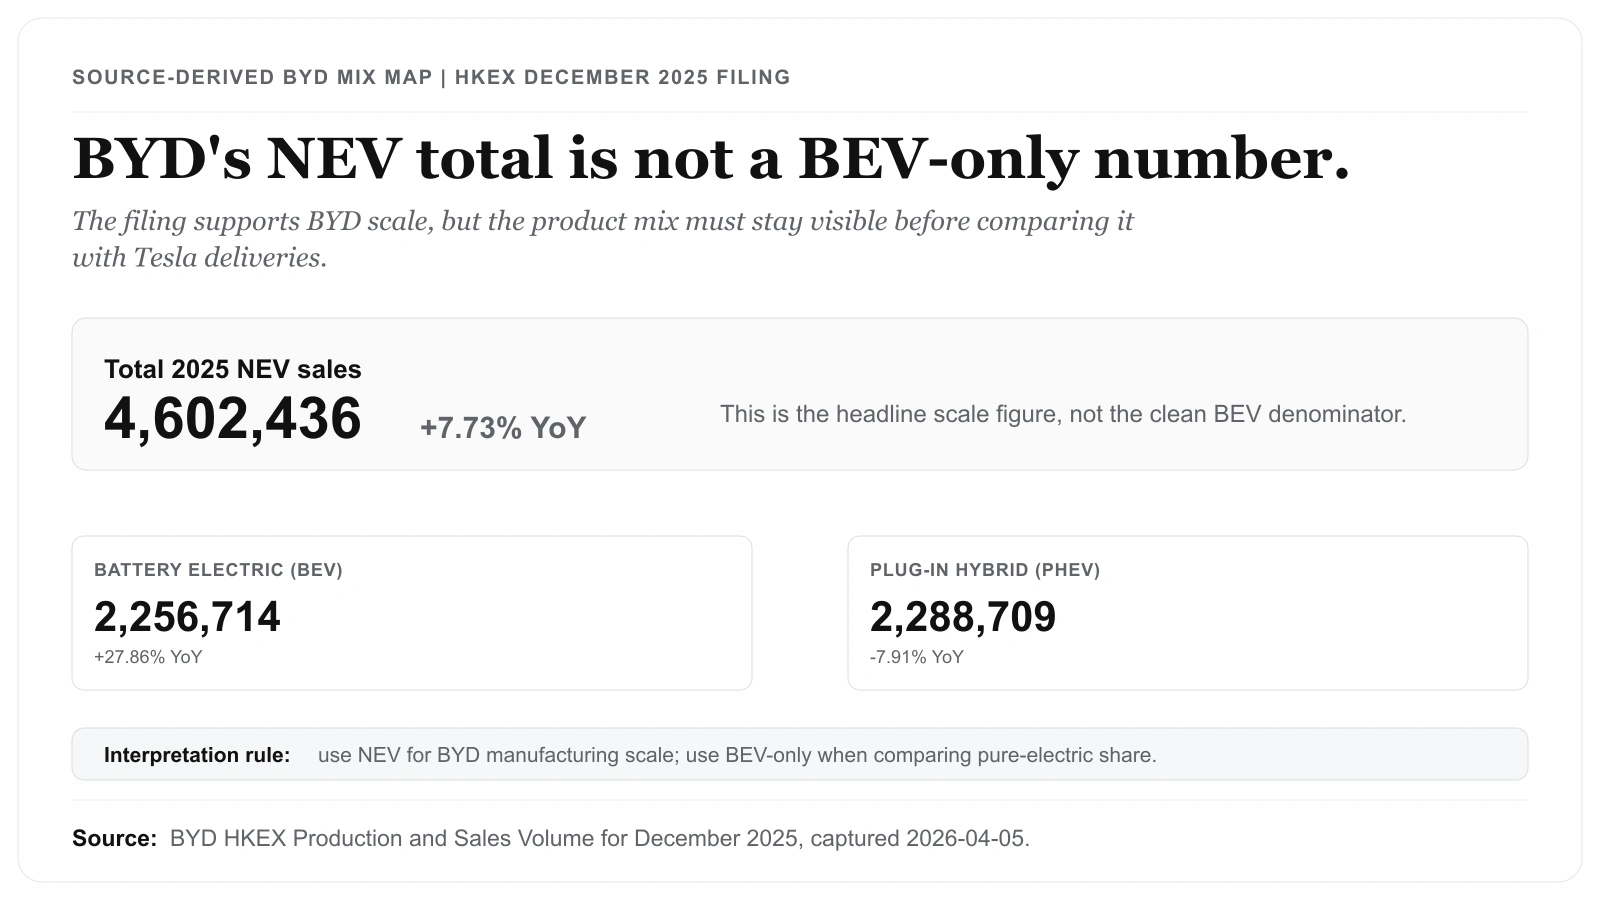
Source-derived mix map based on BYD's 2025 NEV sales — figures from BYD's HKEX filing, "Production and Sales Volume for December 2025", captured 2026-04-05 (NEV 4,602,436; battery-electric 2,256,714; plug-in hybrid 2,288,709). The numbers are the source's; the layout is ours.
Tesla's investor-relations release is kept as the matching source note rather than a narrow standalone table strip: Tesla Fourth Quarter 2025 Production, Deliveries & Deployments, captured 2026-04-05, reported 1,636,129 total 2025 vehicle deliveries in the "2025" table.
The source stack now has distinct roles: BYD's HKEX capture proves the broad NEV scale; Tesla's IR release supplies the BEV-only delivery denominator; the hero denominator map compares definitions without pretending the two tables share one denominator. The filings tell a clear story: BYD's 2025 scale is far ahead in headline volume, but product mix matters.
What the Street is Pricing
Public market pricing reflects two different stories at the same time. One story rewards BYD for manufacturing scale, vertical integration, and local-market momentum. The other still values Tesla for BEV brand power, software optionality, energy storage, and the possibility that operating leverage can recover if volume stabilizes.
Start by sizing the headline gap with the post's own two figures. Dividing BYD's 4,602,436 disclosed 2025 NEV units by Tesla's 1,636,129 BEV deliveries gives roughly 2.8x — BYD's disclosed unit base is nearly three times Tesla's, an absolute gap of about 2.97 million units (4,602,436 minus 1,636,129). That ratio is the single number doing the most work in the bull-BYD scale narrative. But it is a mixed-denominator ratio: the numerator is broad NEV (PHEVs included) and the denominator is BEV-only, so 2.8x is the ceiling on the "scale lead," not the electrification lead. The true BEV-versus-BEV multiple sits below 2.8x by exactly the share of BYD's 4,602,436 that is PHEV, so the reader should keep BYD's BEV-only count separate before treating the 2.8x headline as an EV-share gap.
The filing evidence here supports the scale debate, not a valuation verdict. It does not justify a specific valuation output, a formal stock conclusion, or a clean single-leader label. It only says that any 2026 comparison has to separate unit volume from mix quality before drawing a stock-market conclusion — and that the 2.8x figure shrinks the moment the denominators are matched.
Risks to the Thesis
Use a two-layer test instead of a single headline metric:
- Scale test: Compare annual units to understand manufacturing and channel reach.
- Mix-quality test: Track BEV mix, pricing discipline, and margin stability to evaluate earnings quality.
Today, the first test favors BYD on disclosed total volume. The second test remains open and requires additional quarter-by-quarter disclosure to determine whether higher unit volume converts into durable profitability.
The main risk is definitional drift. A bullish BYD reading can overstate the lead if NEVs are compared directly with Tesla BEV deliveries. A bullish Tesla reading can understate the pressure if it ignores BYD's scale advantage and manufacturing cadence. Either mistake turns a source-based comparison into a narrative shortcut.
What to Watch in 2026 Reporting Windows
A practical monitoring checklist for upcoming filings:
- BYD: BEV-versus-PHEV mix disclosure and whether volume growth is paired with stable per-vehicle economics.
- Tesla: Production-to-delivery conversion and whether operating leverage holds as growth normalizes.
- Both companies: Evidence that growth is supported by recurring cash generation, not just shipment expansion.
This framework is intentionally mechanical. It keeps the analysis citation-friendly and reduces narrative drift when volatility spikes around earnings releases.
Definition Discipline: NEV Is Not the Same as BEV
One of the biggest interpretation errors in EV coverage is treating all unit numbers as if they represent the same product mix. They do not. BYD's disclosed 2025 figure in the cited HKEX filing is an NEV total, while Tesla's cited 2025 figure is BEV deliveries. Both are valid disclosures, but they answer different analytical questions.
If the objective is pure electrification share, BEV-only comparability matters more. If the objective is manufacturing scale and channel throughput, a broader NEV lens can still be informative. Mixing these use cases without labeling the definitions is where misleading conclusions start.
For publication quality, the minimum standard is simple:
- State the metric definition before presenting rank-order conclusions.
- Keep the same denominator throughout each comparison block.
- Flag any apples-to-oranges risk in plain language before drawing an investment takeaway.
This does not make the analysis slower; it makes it auditable.
A Repeatable Update Template for the Next Releases
To keep this page useful across future filings, use a fixed update template each quarter:
- Step 1: Refresh the latest disclosed annual or year-to-date unit totals from primary sources.
- Step 2: Split scale commentary (units) from quality commentary (mix, margin, cash conversion).
- Step 3: Add one source-capture visual per key table and include capture date in the article body.
- Step 4: Remove unsupported narrative claims that cannot be traced to a filing, transcript, or official release.
- Step 5: Re-check EN and KO parity so both versions preserve the same factual meaning.
This process is designed for trust first, then distribution. It improves GEO readiness because answer engines can quote explicit definitions and traceable source statements instead of ambiguous narrative framing.
What Flips the Call
Current primary filings support one clear point: BYD has overtaken Tesla on disclosed 2025 annual unit scale under a broader NEV definition. They do not support a simple single-leader conclusion on long-term value creation.
The call flips toward BYD if BEV mix improves while unit growth continues without clear margin erosion. It flips back toward Tesla if delivery conversion, pricing discipline, and operating margin stabilize while BYD's headline growth proves more dependent on lower-margin PHEV mix. Until then, compare like with like, separate scale from mix quality, and update conclusions each quarter as new filings are published.