Market & Macro
What Sandisk's 78.4% NAND Margin Says About the SNDK Stock Cycle
Sandisk's FY2026 Q3 margin reset met a post-print selloff and heavy short interest. The Q4 durability test that decides whether the SNDK cycle holds.
(Sources: Sandisk Q3 FY2026 financial results press release, Sandisk Q3 FY2026 BusinessWire mirror, Yahoo Finance SNDK quote page, Yahoo Finance SNDK key statistics, Micron Q2 FY2026 results, Western Digital Sandisk spinoff completion)
On this print the top line reads $5.95 billion; the Q4 guide says the next one should read $7.75 billion to $8.25 billion. That gap is unreadable until "78.4%" is pinned down. So the desk work started with a definition check — the non-GAAP gross margin came straight off the Q3 FY2026 release and was verified against the revenue line in the same exhibit, and only then did we set the Q4 guide beside it. The Yahoo Finance positioning capture sat in a separate lane the whole time, so the 10.29% short-of-float reading never bled into the operating numbers.
Related reading: What the 2026 FOMC Calendar Says About When Fed Cuts Can Come | The KRBN Wrapper Is the First Check Before Carbon Credit Exposure | Verify Your Broker Before You Pick a Single U.S. Stock
Thesis
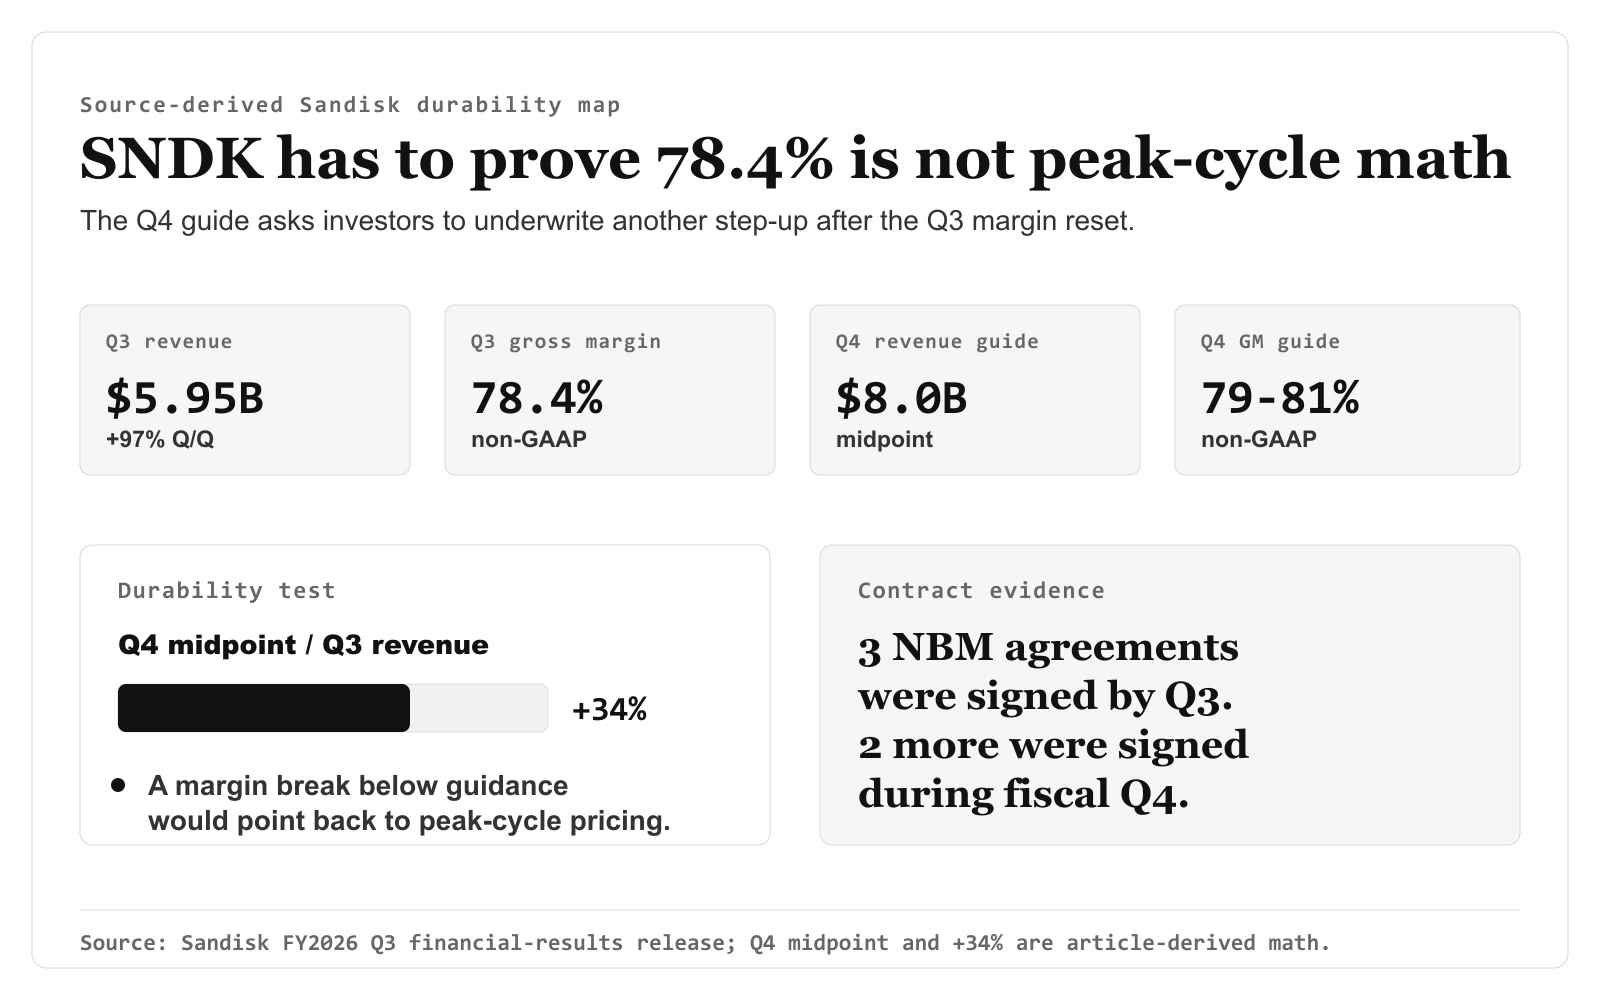
The numbers that matter here are not about NAND demand recovering. The Q3 FY2026 release showed a full reset in the economics of the business: revenue of $5.95 billion, non-GAAP gross margin of 78.4%, and Q4 guidance for revenue of $7.75 billion to $8.25 billion with non-GAAP gross margin of 79% to 81%.
The falsifiable thesis is narrow: SNDK can keep a premium only if the next two prints show that high NAND pricing is being locked into multi-year enterprise SSD contracts rather than merely pulled forward by a supply squeeze. A sequential gross-margin break below the Q4 guide range, or weaker NBM backlog disclosure, would make the current valuation look much more like peak-cycle pricing than structural repricing.
Source Evidence Snapshot
The hero image now carries the Q3/Q4 durability test rather than a raw results card. The body evidence keeps three separate roles: market context, positioning pressure, and a corrected source-derived trajectory chart using Q1, Q2, Q3, and the Q4 guide midpoint. Segment mix remains a linked source note rather than a second chart built from the same release.
 Source-derived market-context map based on the Yahoo Finance SNDK quote page capture retained in this article. It keeps the May 7, 2026 quote capture separate from operating evidence: last price $1,339.96, after-hours $1,326.57 (-1.00%), and market cap $198.4B; Sandisk release figures remain the source for Q3 fundamentals.
 Source-derived positioning-pressure map based on the Yahoo Finance SNDK key statistics page capture retained in this article. It uses the retained capture for institutional ownership of 83.70%, 9.75M shares short, and 10.29% of float short as of April 15, 2026; the roughly 95M implied float is article-derived math.
 Source-derived FY2026 trajectory chart using the Sandisk Q1 FY2026 SEC exhibit, Sandisk Q2 FY2026 release, and Sandisk Q3 FY2026 release. It corrects the sequence to official Q1/Q2/Q3 revenue and non-GAAP gross margin, then uses the Q4 guidance midpoint of $8.0B and 80.0% for the forward guide point.
Source note: Sandisk Q1 FY2026 SEC exhibit, Sandisk Q2 FY2026 release, and Sandisk Q3 FY2026 release. Segment mix remains part of the analysis, but it stays as a linked source note; the visual set now focuses on the Q3/Q4 durability test, market context, positioning, and corrected FY2026 trajectory.
What the Street is Pricing
The quote capture showed the stock already trading as if Sandisk had escaped the normal NAND cycle. Start with what the company's own guide demands. The Q4 midpoint sits at $8.0 billion — the average of the $7.75 billion to $8.25 billion range — which is a $2.05 billion, or roughly +34%, sequential jump on the $5.95 billion Q3 base. That is the step-up the market is already paying for: not a recovery, but an acceleration off a print that itself reset the margin structure.
The positioning data sharpens, rather than softens, that read. The release's own figures imply a free float of about 95 million shares (9.75M short divided by the 10.29% short-of-float reading), so this is a genuinely thin pure-play NAND name. Against that float, part of the move can be a fundamental repricing, part can be forced covering on a 10.29% short base, and part can be momentum that a 95-million-share float amplifies in both directions.
Public consensus targets were not part of the retained evidence for this print; readers should check the latest analyst page on Yahoo Finance, TIKR, or their broker before sizing. The more defensible read from the available evidence is that the market is pricing two things at once: a sustained enterprise SSD shortage and an industry structure that stays disciplined even while high margins invite new supply.
That is a high bar. NAND history says gross margin usually cracks before the revenue line does. If the next call shows revenue growth but lower sequential margin, the market will probably treat it as the first supply-discipline warning rather than as a harmless normalization.
Risks to the Thesis
| Risk | Confirming signal |
|---|---|
| Margin reversion | Q4 FY2026 non-GAAP gross margin below the guided 79% to 81% range, or a Q1 FY2027 guide that implies the peak has already passed. |
| Contract durability | No meaningful update to NBM contract count, term length, or backlog after the Q3 release already highlighted five agreements. |
| Supply response | Samsung, SK Hynix, Kioxia/Sandisk, or Micron commentary showing faster layer transitions or capacity adds than the demand base can absorb. |
| Positioning unwind | Short interest falls sharply while the share price stops making progress, which would imply the squeeze component has been spent. |
The most important risk is not that NAND is cyclical in the abstract. It is that the first visible crack tends to look small. A 200 basis point sequential margin miss would be enough to shift the article's frame from "structural shortage" toward "late-cycle earnings peak."
What Flips the Call
The next decisive evidence is Sandisk's Q4 FY2026 release and management's first FY2027 demand commentary. Two numbers carry the weight.
First, reported Q4 non-GAAP gross margin versus the 79% to 81% guide. A print near the top of the range, paired with a Q1 FY2027 guide still around peak levels, would keep the structural shortage case alive. A print below the range would be the first clean break.
Second, NBM backlog and contract count. The Q3 release already established that large customers were willing to sign longer enterprise SSD agreements. If that count grows, Sandisk's earnings power looks less like a one-quarter commodity spike. If the count stalls, the current valuation has to absorb much more cycle risk.
The stock can still deserve a premium, but only if the next disclosures prove that Q3 was the start of a tighter NAND regime, not the most profitable quarter of a classic supply squeeze.