Market & Macro
What Higher Rates and Hormuz Risk Say About S&P 500 Sector Rotation
S&P 500 sector rotation, read through Federal Reserve policy language and official energy-flow data — without forcing it into an anti-tech trade. A Q1 2026 view.
(Sources: Federal Reserve implementation note, March 18, 2026, EIA - Amid regional conflict, the Strait of Hormuz remains critical oil chokepoint, EIA - About one-fifth of global liquefied natural gas trade flows through the Strait of Hormuz)
The social-media rotation narratives went in the bin first. "Tech is over" kept circulating without a primary-source anchor, so that feed — the one we usually scroll before anything else — got set aside for this piece. What survived the cut: the Federal Reserve's March 18, 2026 implementation note, whose 3.5% to 3.75% target range is treated here as the hard fact, and the EIA Hormuz pages, used for energy-flow context rather than the headline. The detailed Hormuz screenshots stay in the dedicated energy brief. This article leans on the one policy capture and one synthesis chart we could fully verify.
Related reading: What the 2026 FOMC Calendar Says About When Fed Cuts Can Come | The KRBN Wrapper Is the First Check Before Carbon Credit Exposure | Verify Your Broker Before You Pick a Single U.S. Stock
Thesis
Most of the Q1 2026 rotation talk collapses into two slogans, and neither holds up. "Tech is over" is too simple. "Just chase the dip" is too simple too.
The stronger frame is that policy and physical-market conditions changed enough that concentration started to deserve a larger hedge. Energy and industrials did not suddenly become better businesses than every AI leader. They became more useful portfolio sleeves because they respond to different risk drivers.
This article now keeps the visual evidence focused on the rotation thesis itself. The detailed Hormuz screenshots remain in the dedicated energy-risk brief; here, the energy link is used as a supporting macro input rather than repeated as the main visual story.
Source Evidence Snapshot
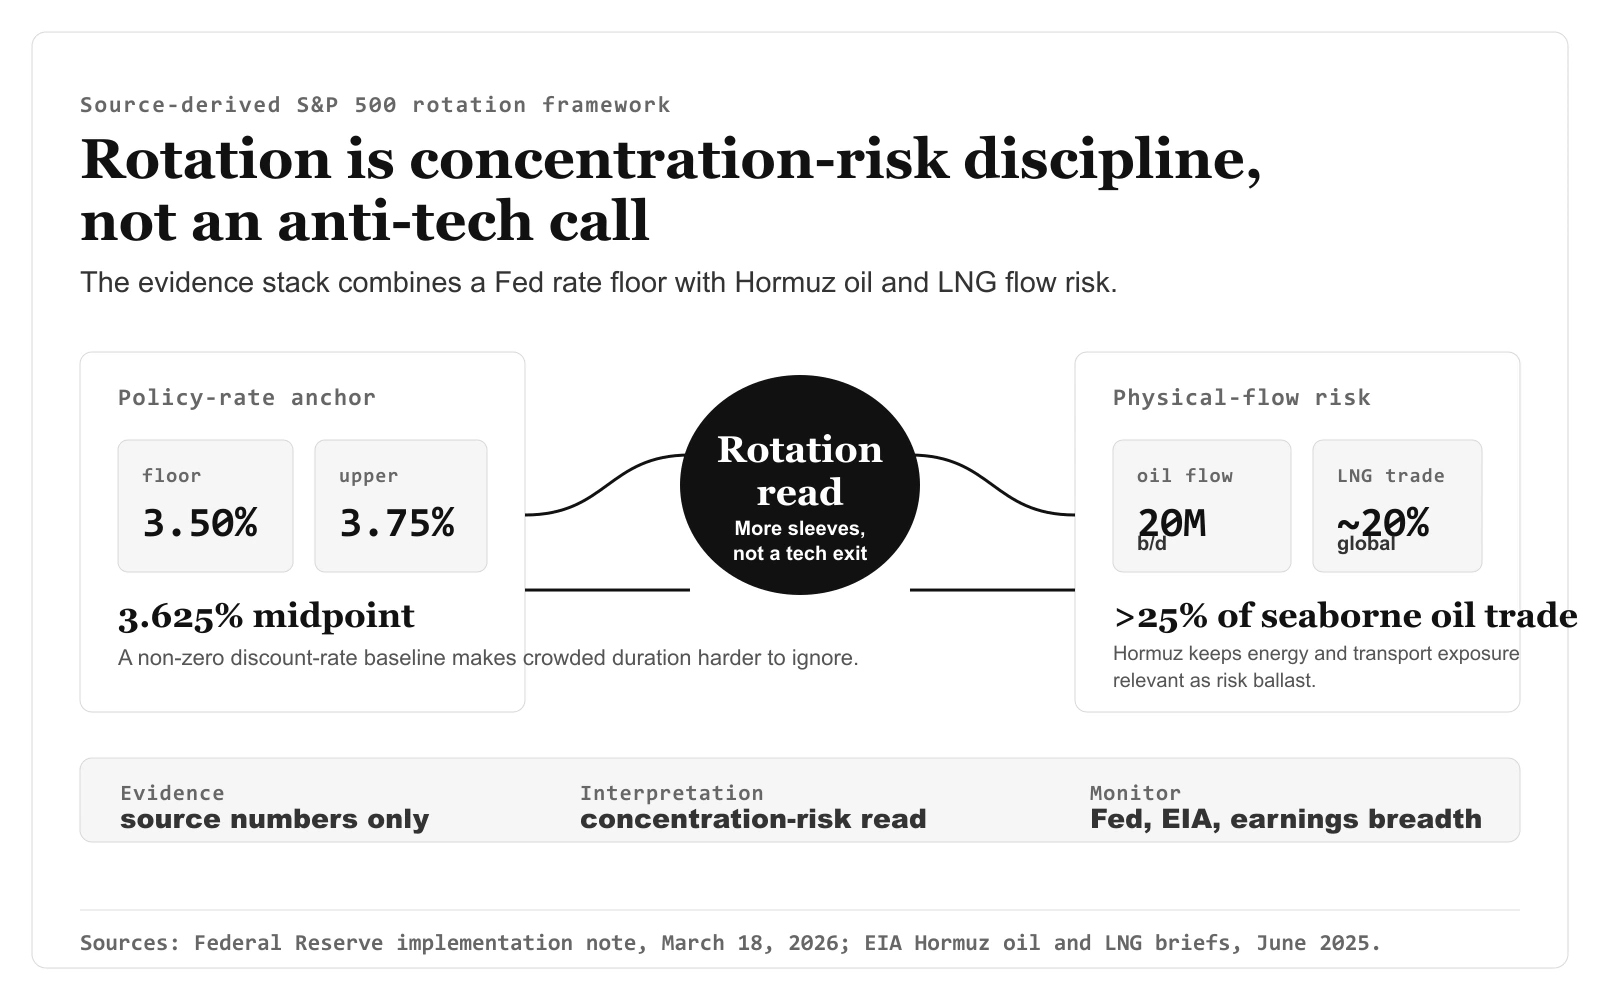
The hero image now carries the aggregate rotation framework: Fed rate floor, Hormuz oil flow, Hormuz LNG exposure, and the article-derived concentration-risk read. The body evidence keeps the official Fed policy-rate anchor separate, so the article has one synthesis visual and one primary-source policy lane instead of repeating the same screenshot twice.
Source capture: Federal Reserve - Implementation Note issued March 18, 2026, captured 2026-04-09; the policy-rate anchor below renders the official target range and implementation rates from that page. The rotation implication remains article-derived.
 Source-derived Fed policy-rate anchor based on the Federal Reserve Implementation Note issued March 18, 2026. It keeps the target range of 3-1/2 to 3-3/4 percent, interest on reserve balances of 3.65%, standing repo rate of 3.75%, ON RRP offering rate of 3.5%, and $160B per-counterparty limit in one official-policy lane; the rotation implication remains article-derived.
The energy-security input is supported by EIA's Hormuz pages, which state that the corridor remains a critical oil chokepoint and that roughly one-fifth of global LNG trade also flows through the same route. Those source captures are kept in the dedicated Hormuz article so this S&P 500 article does not look like a duplicated energy brief.
Higher rates changed the math for crowded growth
The March 18, 2026 implementation note matters because it kept the policy range at 3.5% to 3.75%. That is not an emergency-tight regime, but it is also not a low-rate backdrop where investors can ignore duration risk.
Read the range itself, not just the headline level. The band spans 0.25 percentage points (3.75% minus 3.5%), one standard 25-basis-point increment, with a 3.625% midpoint. That is a deliberately narrow corridor: the Fed is not signaling uncertainty about where policy sits, it is anchoring a discount rate firmly in restrictive territory. For a long-duration equity, the relevant number is not the 25-basis-point width but the floor — every future cash flow is now discounted against a baseline no lower than 3.5%, with no easing yet committed.
When long-duration growth equities are priced aggressively, that floor matters. It raises the cost of disappointment. A strong operating business can still see its multiple compress if the market decides it paid too much for future growth.
That is one reason sector rotation became more believable in 2026. It was not just about tech getting "tired." It was about a higher-rate baseline making portfolio concentration more fragile.
Energy risk made the old-economy sleeves more relevant again
The EIA evidence gives the second reason. The Strait of Hormuz remains a critical oil and LNG transit route, which means energy and industrial names can start behaving less like simple diversification buckets and more like active risk-balancing exposures.
That does not mean every energy spike becomes a long-term trend. It means physical-market risk can justify a bigger premium for sectors tied to commodity flows, power systems, infrastructure, transport, and defense-adjacent capital cycles.
This is what many rotation takes miss. The shift was not only from "growth" to "value." It was from one narrow cash-flow engine toward multiple cash-flow engines:
- AI and software demand,
- physical energy and transport security,
- industrial and grid capex,
- and policy-sensitive rate exposure.
Why rotation did not require a bearish call on AI
The strongest version of the rotation case is not anti-tech. It is anti-lazy concentration.
You can still believe that AI remains the dominant multi-year theme and also conclude that:
- energy deserves a larger weight because geopolitical supply risk rose,
- industrials deserve a larger weight because physical capex remained strong,
- and mega-cap tech deserves tighter position sizing because expectations stayed high.
That is the more practical 2026 read. Rotation was less a rejection of technology and more a reminder that concentration has a cost when rates stay elevated and physical-market risks return.
A practical portfolio framework
The more durable setup is to run three sleeves instead of one:
- Core compounders with strong operating evidence.
- Cyclical or physical-market ballast in energy and industrials.
- Tactical risk controls when volatility and concentration both rise.
The purpose is not to predict every leading sector each month. The purpose is to stop a portfolio from depending too heavily on one factor, one duration profile, or one narrative.
What to monitor next
The rotation thesis should be updated with a fixed evidence sequence, not with daily sector headlines. First, check whether the Federal Reserve keeps the target range language near the same level or starts moving toward a clearer easing path. Second, check whether EIA energy-flow updates still support a physical-market risk premium rather than a one-week headline scare. Third, compare earnings breadth outside the largest AI names with the cost pressure facing transport, industrial, and consumer-facing businesses.
If those three signals keep pointing in the same direction, the case for a broader portfolio mix stays intact. If rates ease, energy-flow risk fades, and earnings breadth narrows again, the rotation argument becomes much weaker.
What changes the rotation read
The 2026 rotation story worked because policy and physical-market evidence both moved in the same direction. Higher rates made concentration less forgiving. Energy-security risk made old-economy exposures more useful again.
That does not mean technology leadership is over. It means the market gave investors a reminder that one dominant narrative is not the same thing as a balanced portfolio.