Energy & Commodities
Hormuz Flow Data Keeps Iran Energy Risk on the 2026 Watchlist
Iran-related energy stress, read through EIA and IEA evidence on Hormuz oil and LNG flows — a 2026 sector-risk map, not a headline reaction.
Thesis
(Sources: EIA - Amid regional conflict, the Strait of Hormuz remains critical oil chokepoint, EIA - About one-fifth of global liquefied natural gas trade flows through the Strait of Hormuz, IEA - Strait of Hormuz factsheet, IEA - Oil Market Report)
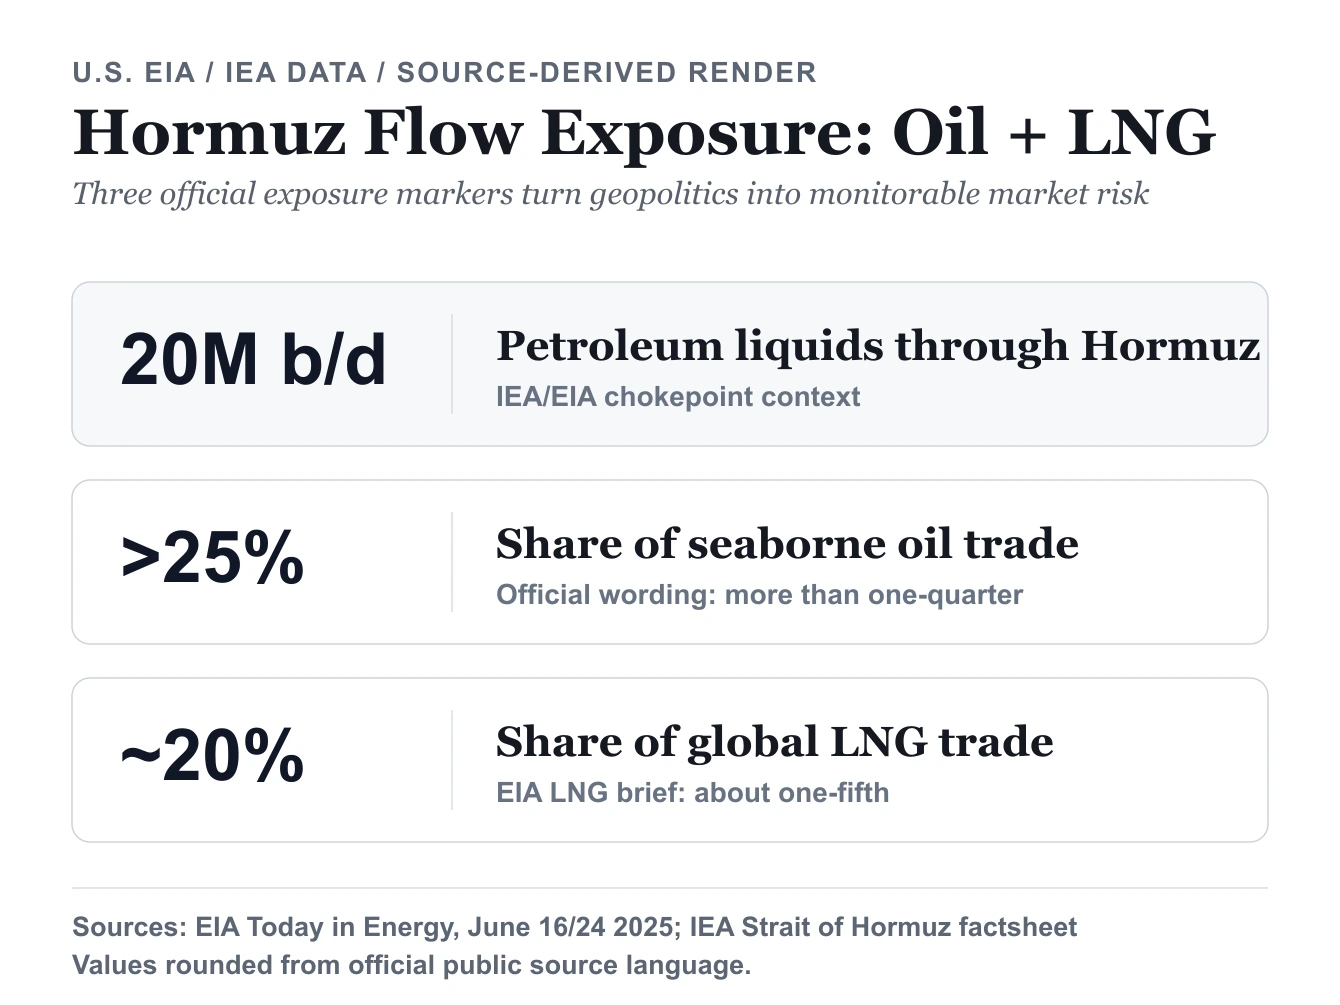
Roughly one-fifth of global LNG trade — not just crude — moves through Hormuz, by EIA's count. That single ratio did more to reorganize this page than any escalation headline. We worked the primary documents in sequence: EIA's June 16 and June 24, 2025 briefs first, then the IEA Strait of Hormuz factsheet for the energy-security framing, then the publication cadence of the IEA Oil Market Report. Read in that order, the evidence stops supporting a crude-only "war premium" story and starts demanding a flow-persistence test.
Related reading: The EIA Release Calendar Puts Crude Risk and Energy Stocks on a Clock | What ChatGPT, Gemini, and Claude Can't Replace in Stock Research | Verify Your Broker Before You Pick a Single U.S. Stock
Sizing that number sharpens the question. If roughly one-fifth of global LNG trade transits Hormuz, then by complement about four-fifths does not — so the corridor is not the whole LNG market, but it is a concentrated ~20% slice with no easy substitute on short notice. That ratio is the real stake: a reliability shock does not have to touch the other 80% to reprice gas and power, because the at-risk fifth is exactly the volume that has nowhere else to go.
A "war premium" framing kept in the abstract is the weak way to read this. The stronger version asks a narrower question: how much of the world's oil and LNG system still relies on Hormuz-linked transit, and what happens to asset pricing if that transit channel becomes meaningfully less reliable?
This framing turns geopolitical drama into something market readers can actually monitor. It also keeps this article distinct from the dedicated Hormuz chokepoint brief: the question here is not whether the Strait matters, but how persistent flow risk should move through sector exposure.
Source Evidence Snapshot
The dedicated Hormuz chokepoint article keeps the granular EIA screenshot stack. This Iran-risk page uses the hero chart as the synthesis layer and keeps the supporting references in text, so the same official captures do not repeat across the energy series.
- EIA's June 16, 2025 Hormuz brief anchors the oil chokepoint exposure and says the Strait remains critical even when traffic is not blocked.
- EIA's June 24, 2025 LNG brief extends the same risk path into LNG, gas, and power-market sensitivity.
- IEA's Strait of Hormuz factsheet provides the energy-security context for why bypass capacity and emergency planning matter.
- IEA's Oil Market Report page gives the monthly update cadence readers can use to test whether the shock persists.
What These Sources Actually Support
1) The energy shock channel is still real
The official flow markers support a simple point: this is not a niche chokepoint. A disruption risk around Hormuz is large enough to matter for global oil pricing, freight assumptions, and inflation expectations even before a full closure is confirmed.
2) LNG is part of the same risk system
The LNG source page matters because many equity and macro reactions still focus too narrowly on crude. If roughly one-fifth of global LNG trade also relies on the same corridor, utilities, chemicals, and import-dependent power systems deserve to be part of the analysis.
3) The market question is persistence, not panic
The IEA OMR release cadence looks mundane, but it is useful because it reminds readers how to update the thesis. A durable energy repricing should survive into recurring official market-balance updates. If it does not, the market may be pricing fear rather than a real supply regime shift.
The Second-Order Effects That Matter Most
Energy producers benefit first, but not all energy exposure is the same
If risk premia remain elevated across multiple reporting windows, upstream producers tend to have the most direct sensitivity. Integrated majors can still benefit, but usually with lower volatility because refining and trading can smooth some of the move.
For sector analysis, that means the relevant question is not simply "add broad energy exposure." It is whether the exposure is high-beta upstream, diversified integrated cash flow, or a more delayed services response that depends on producer capex.
Airlines, shipping, and imported-energy manufacturers sit on the other side
The same setup that supports energy producers can pressure sectors with direct fuel or freight sensitivity. Airlines are the simplest example, but shipping and energy-import-dependent industrial businesses are often more important because their cost pressure can feed into broader inflation.
This is where a lot of geopolitical coverage stays too shallow. A sustained oil and LNG premium is not just an energy story. It can also be an earnings-compression story for transport, industrial, and consumer-facing businesses.
Europe and Asia can feel the pain differently from the U.S.
The U.S. is not immune to higher oil prices, but import dependence and industrial energy sensitivity are not evenly distributed. LNG-importing and manufacturing-heavy regions can feel the earnings effect more directly, especially if shipping routes, freight insurance, and input costs move together.
That is one reason broad-index positioning can miss the real dispersion. The same macro shock can support selected U.S. energy names while pressuring European or Asian industrial exposures.
A Better Monitoring Workflow
Use a fixed update sequence instead of reacting to each escalation headline:
- Recheck EIA flow and chokepoint updates for evidence that the physical system actually changed.
- Recheck LNG-specific exposure because gas and power-market spillovers can matter as much as oil.
- Recheck the next IEA Oil Market Report to see whether the broader balance view starts carrying the shock through official supply-demand language.
- Only then adjust sector positioning or macro assumptions.
This sequence helps separate noise from durable repricing.
Practical Sector Framing
The most disciplined way to use this theme is to think in sleeves rather than in one one-way view:
- energy exposure for direct commodity-risk sensitivity,
- inflation-aware risk controls for cross-asset spillover,
- and explicit watchlist pressure points where fuel, freight, or energy import costs can compress margins.
That is a better structure than treating the topic as a one-day "risk-off" trade. The real opportunity is usually in the dispersion that follows when different sectors process the same shock through different cost structures.
What changes the flow-risk read
Iran-related market risk matters when it changes the reliability of a globally important oil and LNG corridor. EIA and IEA evidence already shows why Hormuz remains large enough to matter.
The strongest analytical edge here is not headline speed. It is evidence discipline: verify whether the flow risk persists, then map that persistence into sector beneficiaries, sector pressure points, and inflation-sensitive risk markers.