Market & Macro
What Palantir Stock's Short Interest Actually Says About Its Premium
Palantir's RPO durability and FY2026 guidance against a steep valuation and heavy short interest — plus the software-agent disruption question.
(Sources: Nasdaq official quote API, Nasdaq official quote summary API, Nasdaq official short-interest API, Palantir Q4 2025 investor presentation PDF, OpenAI Codex page, Anthropic Claude Code)
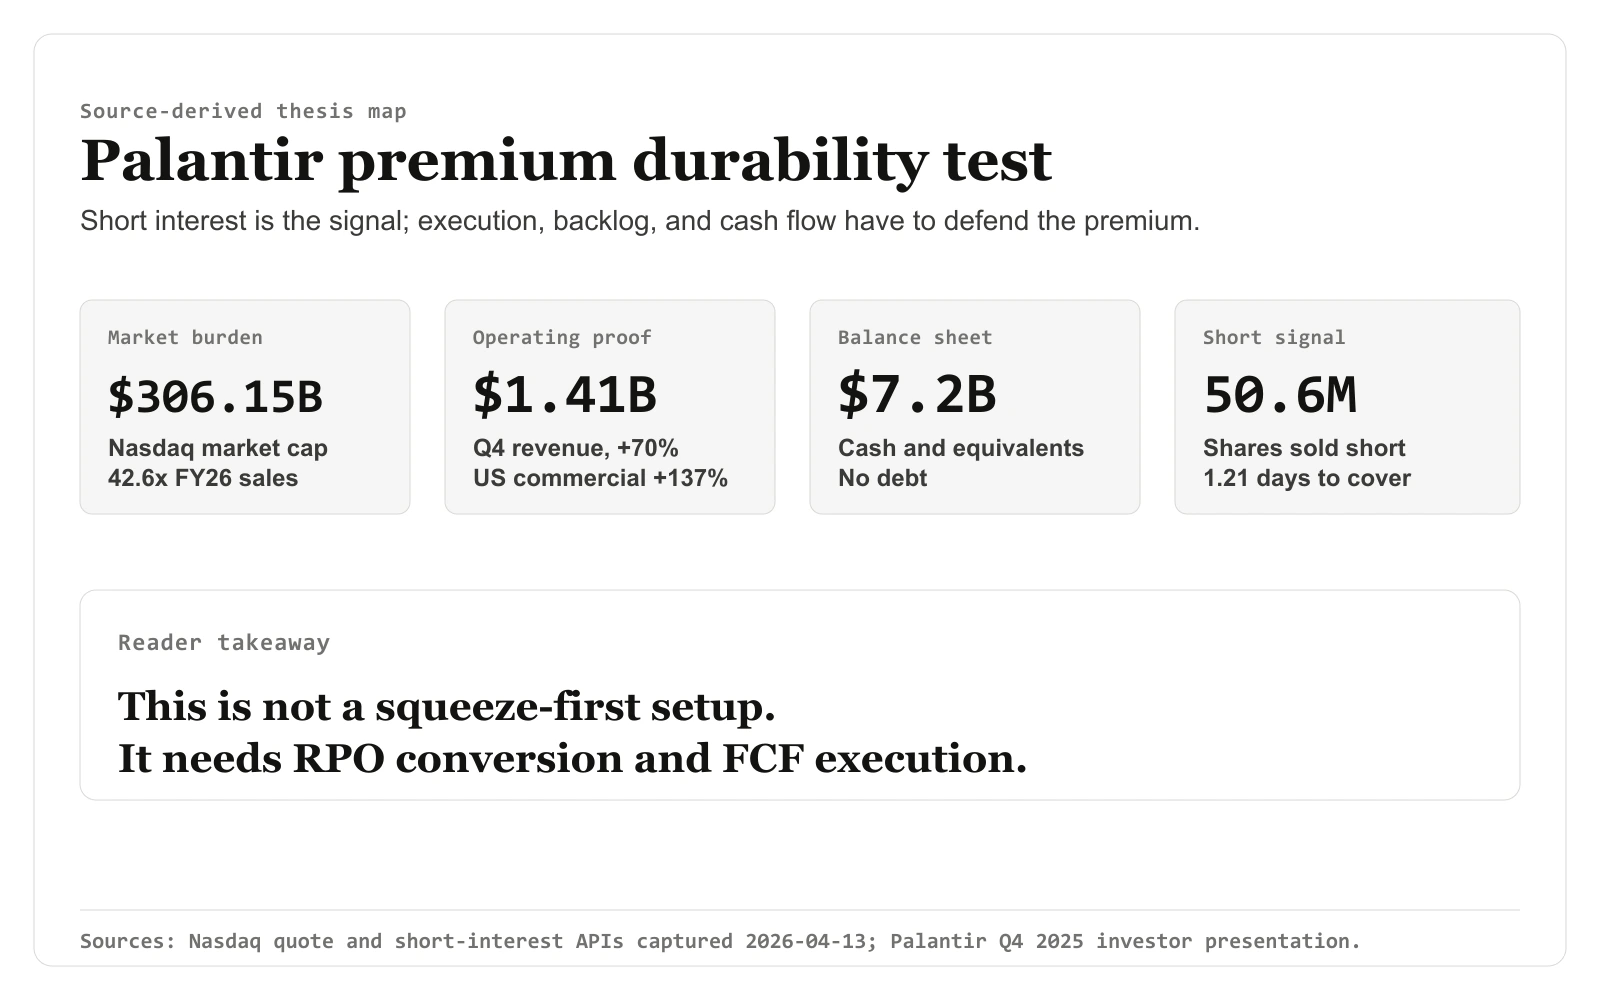
50,576,677 shares sold short is the kind of figure that looks dramatic in isolation — until the 1.212798 days to cover sitting in the same Nasdaq short-interest response reframes it. That response was our first stop, read against the prior settlement before any of the valuation case. Setting the count beside the $306.15 billion market cap from the April 13, 2026 quote keeps the short-interest line anchored to live price rather than treated as a standalone squeeze signal.
Related reading: What the 2026 FOMC Calendar Says About When Fed Cuts Can Come | The KRBN Wrapper Is the First Check Before Carbon Credit Exposure | Verify Your Broker Before You Pick a Single U.S. Stock
Thesis
The legitimacy debate around Palantir is over. The official Q4 2025 materials show fast revenue growth, accelerating U.S. commercial adoption, large RPO, a large cash balance, and no debt.
The 2026 stock question is narrower: can those strengths defend the premium already embedded in PLTR? The Nasdaq quote response captured on April 13, 2026 showed PLTR at $128.06 with a market cap of roughly $306.15 billion. Palantir's FY2026 revenue guidance was $7.182 billion to $7.198 billion, which puts the stock near 42.6x forward sales using the midpoint.
That is why short interest should not lead the article. The more useful frame is premium durability: what must stay true for Palantir to keep a premium software multiple?
Source Evidence Snapshot
The hero map now carries the premium-durability sequence: market-cap burden, operating proof, cash balance, and short-interest context. The body evidence keeps three non-overlapping visual roles: market premium, short-interest liquidity, and backlog-to-guidance durability. The Q4 revenue-growth slide remains a linked source note to avoid repeating another investor-deck crop.
 Source-derived market premium map: figures from Nasdaq official quote APIs, retrieved 2026-04-13, and Palantir Q4 2025 investor presentation guidance: PLTR last sale $128.06, market cap about $306.15B, FY2026 revenue guidance midpoint about $7.19B, and adjusted free cash flow guidance midpoint about $4.025B. Forward sales of 42.6x, implied free cash flow yield of 1.3%, and about 77x forward adjusted free cash flow are article-derived math. Figures are source-derived; layout is editorial rendering.
Quote API |
Summary API |
Investor presentation.
Source-derived market premium map: figures from Nasdaq official quote APIs, retrieved 2026-04-13, and Palantir Q4 2025 investor presentation guidance: PLTR last sale $128.06, market cap about $306.15B, FY2026 revenue guidance midpoint about $7.19B, and adjusted free cash flow guidance midpoint about $4.025B. Forward sales of 42.6x, implied free cash flow yield of 1.3%, and about 77x forward adjusted free cash flow are article-derived math. Figures are source-derived; layout is editorial rendering.
Quote API |
Summary API |
Investor presentation.
This is the valuation burden. A company carrying more than $306 billion of market value is already priced as a leading software platform, not as an early AI speculation.
 Source-derived short-interest map: figures from the Nasdaq official short-interest and quote APIs, retrieved 2026-04-13. The highlighted fields show 50,576,677 shares sold short at the March 31, 2026 settlement date, 1.212798 days to cover, and average volume of 53,187,326 shares. Figures are source-derived; layout is editorial rendering.
Short-interest API |
Summary API.
Source-derived short-interest map: figures from the Nasdaq official short-interest and quote APIs, retrieved 2026-04-13. The highlighted fields show 50,576,677 shares sold short at the March 31, 2026 settlement date, 1.212798 days to cover, and average volume of 53,187,326 shares. Figures are source-derived; layout is editorial rendering.
Short-interest API |
Summary API.
The short-interest count is large, but the days-to-cover figure changes the interpretation. This looks like a liquid stock with strong valuation disagreement, not a thesis that should rely on a technical squeeze.
Source note: Palantir Q4 2025 investor presentation PDF, page 4, captured 2026-04-13. The operating momentum evidence remains cited here: revenue of $1.41 billion, U.S. commercial revenue of $507 million, and adjusted operating income of $798 million.
 Source-derived RPO coverage map: figures from the Palantir Q4 2025 investor presentation PDF: total RPO of $4.21B, long-term RPO of $2.59B, Q4 billings of $1.489B, Q4 revenue of $1.41B, and U.S. commercial revenue of $507M. The 59% and 36% coverage ratios compare total RPO and long-term RPO with the FY2026 revenue guidance midpoint and are article-derived math. Figures are source-derived; layout is editorial rendering.
Investor presentation.
Source-derived RPO coverage map: figures from the Palantir Q4 2025 investor presentation PDF: total RPO of $4.21B, long-term RPO of $2.59B, Q4 billings of $1.489B, Q4 revenue of $1.41B, and U.S. commercial revenue of $507M. The 59% and 36% coverage ratios compare total RPO and long-term RPO with the FY2026 revenue guidance midpoint and are article-derived math. Figures are source-derived; layout is editorial rendering.
Investor presentation.
RPO makes the story more durable than a single headline quarter. Total RPO reached $4.21 billion, and long-term RPO reached $2.59 billion. These figures do not make PLTR cheap, but they help explain why the market is willing to pay a high multiple.
What the Street is Pricing
The Street is pricing Palantir as one of the software companies most likely to remain strategically important as AI changes the cost of building software.
The short-interest panel supports a narrower point: disagreement exists, but the captured Nasdaq API does not make this a clean squeeze thesis by itself. It gives 50,576,677 shares sold short at the March 31, 2026 settlement date and 1.212798 days to cover. It does not provide short interest as a percentage of float or a prior-period trend in the captured evidence set, so this article does not invent those two fields.
The market is paying for four assumptions: U.S. commercial growth stays far above the software average, RPO continues to convert into visible revenue, the $7.2 billion cash balance and no-debt profile remain strategic advantages, and Palantir's product layer stays close enough to operational control to avoid being commoditized by coding agents.
Two of those assumptions can be sized directly from the figures already on the page. Set the $4.21 billion total RPO against the $7.19 billion FY2026 revenue midpoint and contracted backlog already covers roughly 59% of next year's guided revenue, with the $2.59 billion long-term slice alone covering about 36%. So the second assumption is not a leap of faith: more than half of the guidance is already booked, and the open question is conversion timing rather than whether the demand exists.
That final point is why Codex and Claude Code belong in the discussion without needing to dominate the evidence stack. Coding agents can pressure software categories whose value sits mostly in repetitive implementation work. Palantir's argument is different: it is selling deployed operating systems, data integration, governance, and decision workflows.
The stock price already assumes that distinction matters. At roughly 42.6x forward sales and about a 1.3% implied free-cash-flow yield using the FY2026 adjusted free-cash-flow midpoint, PLTR does not have room for a soft execution story. Invert that 1.3% yield and the market is paying close to 77x forward free cash flow — nearly double the 42.6x it pays on sales. That gap is the whole bet in one number: the price only works if margins keep expanding from here, so the FCF line, not the revenue line, is where a soft quarter would do the damage.
Risks to the Thesis
The main risk is valuation compression. Palantir can remain an excellent business and still produce a poor stock outcome if growth normalizes faster than the current multiple expects.
The second risk is that RPO and billings stop reinforcing the narrative. If contracted demand slows, the market will have less evidence that Palantir's current revenue growth can remain durable.
The third risk is software-sector repricing. If the market concludes that AI-linked software multiples were pulled too far forward, Palantir's premium can compress even if the company keeps executing.
The short-interest data should be treated as a sentiment indicator rather than the bull case. A large short count shows disagreement. It does not remove the need for the business to keep justifying the multiple.
What Flips the Call
The Palantir setup improves if U.S. commercial revenue continues to compound at a materially higher rate than the broader software sector, RPO keeps building, and free-cash-flow conversion stays strong while the balance sheet remains debt-free.
The setup weakens if U.S. commercial growth decelerates sharply, RPO stops converting, adjusted free cash flow undershoots guidance, or the market starts treating coding agents as a reason to reprice all high-multiple software together.
PLTR is best framed as an expensive durability trade, not a squeeze trade. The company has real evidence. The stock already prices that evidence aggressively.